Martin Lewitt (2010.02.20.1634 MST)
[From Rick Marken (2010.02.21.1000)]
Bill
Powers (2010.02.21.0635 MST)
Martin Lewitt (2010.02.20.1634 MST) –
Time series data are often autocorrelated. Your independent variable
(tax policy changes) only changes a dozen or so times, presumably there
is a time lag analysis you should do and then test whether the amount
of time between changes is enough for the dependent variable to fully
respond. The statistical significance of your correlation should be
reduced by the amount of the auto-correlation.
I think Rick probably knows this, since he has taught statistics and
experimental methods (including writing a book on the latter).
Thanks, but I don’t like to point to my credentials as evidence that I
know what I’m doing. After all, we know that credentials, such as a PhD
in psychology, don’t guarantee that one has not wasted one’s career
pursuing an illusion.
As to Martin’s point about autocorrelation, I think your comments to
Martin are most pertinent:
I
don’t quite see what you’re getting at here – you seem to be arguing
on Rick’s side by agreeing that there are no data favoring the idea
that reducing taxes increases growth; all you’re saying is that the
evidence indicating the opposite is not as strong as it might seem to
be. That doesn’t show that decreasing taxes increases growth.
Exactly. The fact is that even by assuming that the sample points in
the tax and growth time series are independent (independence and
autocorrelation are actually two different things; more on that later)
the correlations were not (except in a couple cases) statistically
significant. As you say, reducing the number of degrees of freedom for
the statistical test, as Martin suggests based on the fact that the
series is autocorrelated, simply makes all the correlations not
statistically significant, which makes my point: I can find no evidence
for the claim that lowering taxes is associated with an increase in
growth.
As to autocorrelation and independence, these are actually two separate
concepts. A time series of data points can be independent and have a
high level of autocorrelation or they can be dependent with a low level
of autocorrelation. The former is probably rare; the fact is that
economic time series have a high level of autocorrelation and the
events are not independent. But it is possible for a series of data to
have a high level of autocorrelation while the events in the series are
actually independent. For example, you could have 100 people rate how
much they would pay for a bet where the payoff varies sinusoidally from
the first to last person. The series of 100 ratings will probably vary
sinusoidally as well, and a sine wave has a very high level of
autocorrelation, of course. Yes the data points in both the payoff and
rating series are independent of one another, in the sense that the
payoff or rating for subject n was independent of the payoff or rating
for subjects n-1, n-2, etc. And example of data where there is a low
level of autocorrelation and a high level of sequential dependence
would occur if the same study were done with the same person making all
100 ratings. In that case, it is highly likely that the rating that the
subject gives on trial n would depend on the ratings given on trial
n-1, n-2, etc.
But all this is really irrelevant to what I was trying to show. I use
correlations as a summary measure of the relationship between time
series, where on variable in the time series can be considered the
independent variable in a quasi-experiment. I could just present the
time series for visual inspection, since that is often the way the
results of quasi-experiments are reported. But it’s simpler to report a
correlation, which summarizes (in terms of fit to a linear model) the
relationship between IV and DV in this quasi-experiment using a single
number. I presented the rather small, positive correlation between
taxes and growth not to show that taxes cause growth; the relationship,
significant or not, doesn’t show that; we need a model to understand
why the data behave as they do. I presented the data as a question: why
the heck do economists think that increasing taxes reduces growth?
It is the microeconomic changes in behavior from increasing taxes.
I think what is most amusing about Martin L’s criticisms of my analysis
is that he makes so statements to which his criticisms actually apply.
Beside his complaint about my improper calculation of statistical
significance, Martin’s also complains about the “uncontrolled
confounding factors are easy to point out”. In fact, I look at time
series data in order to minimize confounding (the is what
quasi-experimental design is about, the idea being that it is unlikely
that other variables will be systematically confounded with time
variations in the variables of interest – like taxes and growth - if
these variables are looked at over a long period of time).
So I am well aware of the possibility of confounding and make every
effort to minimize the possibility in my economic analyses. But when
Martin talks about what he considers data he evidences absolutely no
concern about possible confoundings. For example, Martin says: “The
boats being lifted [by US tax cutting policies] are huge new middle
classes in India
and China and the world is better for it”. So Martin has no problem
attributing causality to the one co-occurrence of US tax cuts and the
growth of the middle class in China and India, ignoring all the other
events (possible confoundings) that occurred in US and the world the
same time.
I think several phenomena are being conflated here. The reasons the
boats being lifted are in China and India rather than in the US are
more complex than mere tax cuts in the US. Yes, it took economic
growth to lift those boats, but India and China did have some
comparative advantages in labor costs and regulatory environment, and
US taxes were still relatively high even after tax cuts, and of course,
free trade and globalization policies also assisted in allowing the
transfer of productive activity to India and China. When someone is
engaging in nationalist rhetoric and demagoguing the rich as arguments
for a more coercive policy, I don’t need rigorous statistical proof for
these things. I merely need to weave a plausible alternative
explantion of the facts. The evidential standard for proposing
freedom rather than coercion is lower.
Another example of Martin’s ability to do without
quasi-experimental control of possible confounding variables occurs in
the following analysis:
“The aim [of the tax cuts] was economic efficiency and growth.
Complicating matters is
that the Federal Reserve, which is supposed to be neutral in the
allocation of the returns from increased productivity between labor and
capital, took sides. By considering increases in wages inflationary
and tightening, it saw to it that nearly all the benefit of increased
productivity went to capital. The Repubs and Democrats were both
stupid in not recognizing and correcting this. The double taxation of
returns to equity and high tax rates also decreased the attractiveness
of the US economy as a place for investiment”.
Again, Martin is able to tell that the reason the tax cuts were not
associated with the intended results (lifting all boats) was the Fed
raised rates. Of all the many events going on in the US at this
particular time Martin is again able to tell (without the help of
quasi-experimental control) that Fed rate increases trump the effect of
tax cuts.
The fact is that Martin L. doesn’t seem to care all that much about
data. I think most free-marketers don’t care about or even like data
very much. Why would they? When the data contradict everything you
believe about economics then one of the best policies is to ignore it.
That’s just basic PCT.
Once again, all I have to do is weave a plausible alternative story.
I’m not proposing coercive measures. The plausible alternative serves
two purposes, it points out that the coercive policies may not be
needed, and it subtly shows how poorly understood the economy is, so
that even if there is a crying “need” for the coercive policy, there is
the real possibility that it may not have the desired effect, but even
the opposite effect instead. Everything else being equal, raising
taxes increases revenues, but everything else isn’t equal is it? Not
only do taxes taken from the rightful owners preclude what those people
would have done with the money, the taxes result in other changes in
behavior.
I admit, the nonlinear nature of the economy works both ways. While
my hope is that my proposal to eliminate the double taxation on
dividends combined with capping the deductability of interest will
result in more equity financing and lower levels of leverage in the
economy, the preference for borrowing rather than sharing ownership may
be so great that even more economic activity gets transferred to for
favorable environments.
If the Democrats want to suck the productive elements of society dry,
then they must take a lesson from the USSR and prevent them from
escaping while they still have any juice in them. While the USSR went
to the extremis of armed guards, barbed wire and mine fields, the
Democrats must, at least, oppose free trade and globalization.
You
also seem to be sidestepping another point made by Rick: he said
“Several times in recent years I have seen statistics showing that for
the last century or so each time the ownership of all the country’s
resources owned by the top 1% of the population has increased until -
with the latest one I’ve seen (within the last year) - it has reached
over 80%.”
This actually was said by Dick Robertson. It seems like an incomplete
sentence. I think Dick’s point was that “each time a large share of
ownership goes to a small share of the population the economy goes into
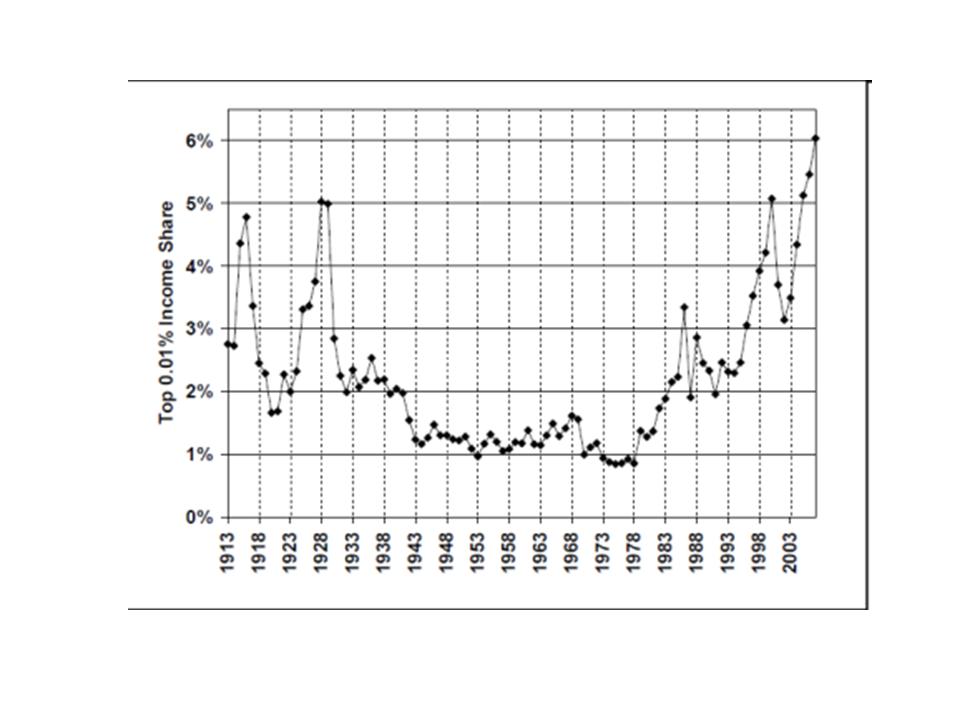
a dive”. I would say this counts for income as well. I’m attaching a
graph of the share of GDI (gross domestic income) going to the top .01%
of the population of the US. Note how the share of income went up (to
5%) right before the Great Depression, then after decreasing to 1% and
staying there for a long time it took off again starting as soon as
Reagan came into office. The graph peaks out again (at 6%) right before
the second great depression of 2008-2009. Coincidence? I don’t think so
It may not be a coincidence. Depressions may hit the extremely rich
particularly hard, or recessions may turn into depressions, because the
top 0.01% get demonized and their wealth confiscated, or the wealthy
get shamed into philanthropy instead of continuing productive
activities. Certainly there is a natural human tendency for
politicians to blame others than themselves. Were there no government
or federal reserve policies that contributed to the concentration of
wealth? I’ve already pointed some out.
Humans have to deal with a complex nonlinear environment often with
only fuzzy incomplete local information. Perhaps our tendency to
develop moral rules and simplified principles and models had adaptive
benefits in such environments. Perhaps they have no predictive value,
just persuasive value? I’d like to think there is value to
generalizing from simplified micro-economic models, but there may not
be. I do like freedom, and appreciate that at least a plausible case
can be made that it works better than coercion.
Democrats like to distort the market in ways that create perverse
incentives, and then blame the people for following those incentives
off a cliff. Even the simple models we already have, predict such
results, although market resiliance makes the timing of the predictions
notoriously bad, sometimes off by a decade or more.
Martin L.