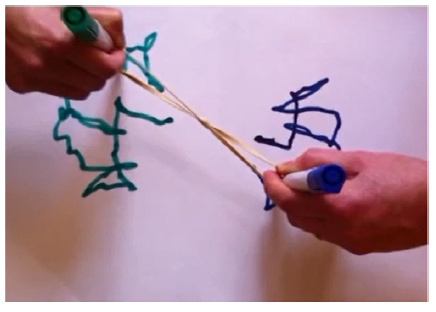
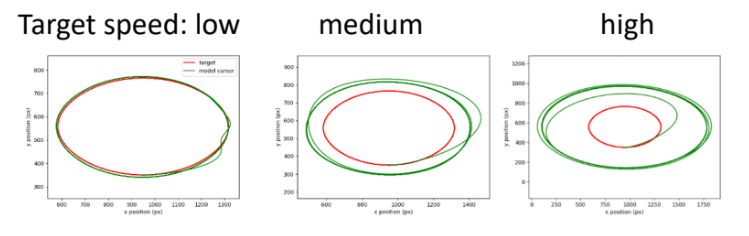
Here is how one person tracked, looking at the target on the screen, and moving a pen on a graphics tablet (Instead of holding a mouse, the person was using a wacom tablet with pen).
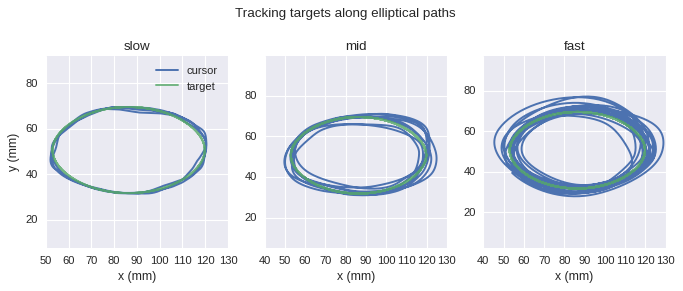
Units in mm of movement of the pen. There is a decrease in accuracy with the speed of movement, but the general shape of each cycle is generally elliptical of similar size to target path shape.
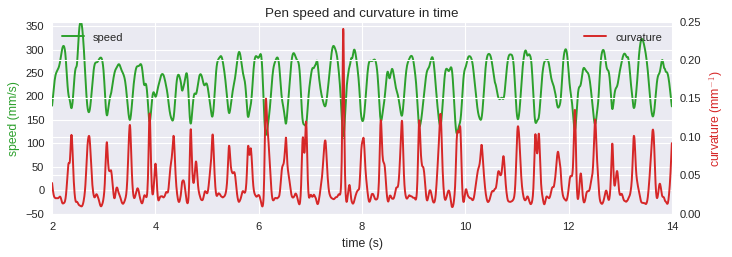
Here are speed and curvature for the pen movements for the fast situation
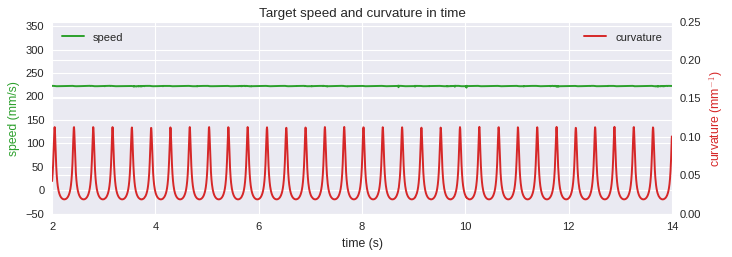
The same for target:
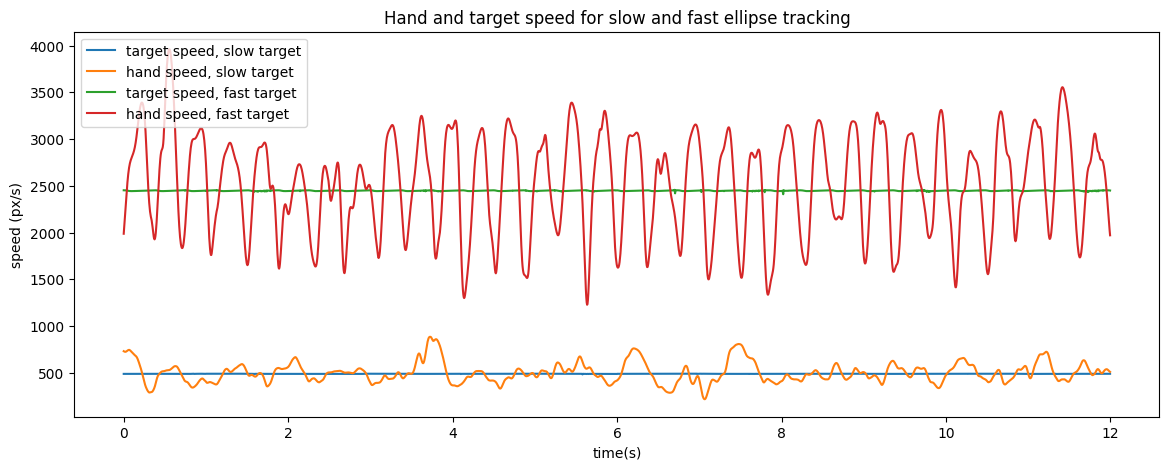
First plot, the speed of the pen and curvature of its path over time shows that in this subject, speed was low when curvature was high, and speed was high when curvature was low. At the same time, the target he was following was not slowing down nor speeding up, and had a completely flat speed profile (green line on second plot).
This relationship between speed and curvature for subject’s movement can be shown in a speed-curvature plot:
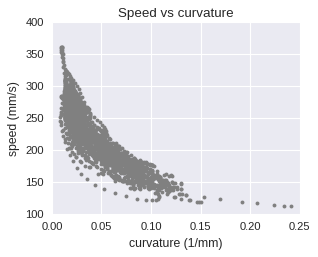
The relationship is not linear, but looks much nicer on the log-log plot:
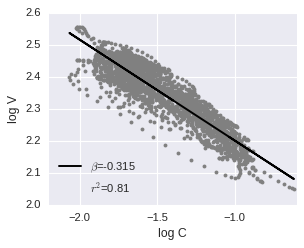
The log-log plot shows the ‘physical’ meaning of the speed-curvature power law - when the curvature is high (‘corners’ of the ellipse) the speed will tend to be lower than when the curvature is low (‘flat parts’ of the ellipse). In this case, the r2 is not particularly high, it it usually higher, I guess because of not super accurate tracking, but the relationship is still pretty obvious.
These sorts of correlations are why everyone gets upset when you say that the power law is a statistical artifact. It can be a statistical artifact due to noise, as Maoz, Portugaly, Flash and Weiss (2005) showed, I can illustrate that if needed, but is generally a real phenomenon that happens at high speeds of hand movement. By “real phenomenon” I mean that people really do slow down their hand movement speed in curved parts of the path, if the overall speed is high. If the overall movement speed is low - a person can pick and choose whatever speed profile they want - constant speed, or high in the corners and slow in the flat parts. At high speed, they cannot choose.
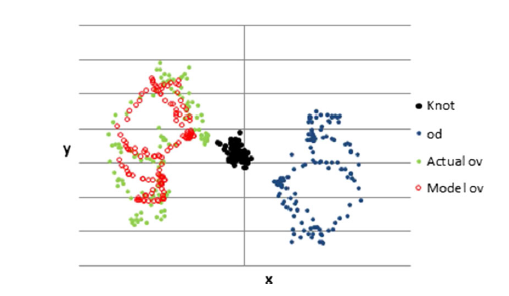
The lead-follow analysis shows somewhat erratic change in angular separation, but generally the separation is around 0 radians. If you take the center of the ellipse as (0,0) of the coordinate system, and then measure the angle between the going from the cursor to the center and the line going from the center to the target, you get this pattern for this subject (same data as above, for the fast situation). Some subjects show a ‘nicer’ pattern, especially after practicing for a while.
This data is from one of the very first experiments we did in the lab, in late 2016, all credit to Alex for coming up with it and leading the analysis. There is much more data from that experiment, different target speed profiles, a whole range on average speeds, several subjects, etc, this one is just for illustration purposes, but everywhere we see the same pattern in the speed-curvature relationship. Whatever the target speed profile, when the average speed is high, subjects have the same beta of 1/3 in the power law.
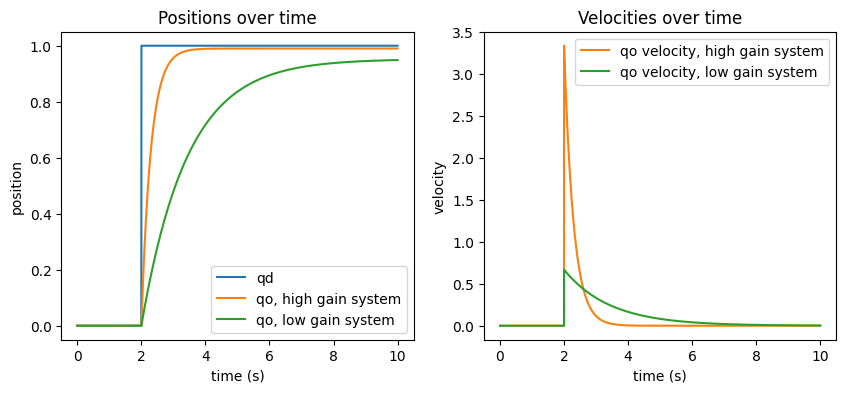
RM: Now have the subject track your finger as it moves in a circle. The tracking is as good or better than it was with the random target but when you stop the movement the subject keeps moving in a circular pattern for about 1/4 sec or so. Clearly stopping the circular target was a disturbance to a higher level variable than was stopping the random target.
Yep. Very well known phenomenon in PCT, I even had the comparison of tracking a random and a circular target as one experiment for my B.A. in psychology. Control of patterns or paths is not that much explored in modelling in PCT.
On the standard position tracking model and the LittleMan - there is not much to say. Both have position tracking as the only level or top level control system. If you put a fast target elliptical target, they will not follow as accurately as humans do. If you put higher gain, they might be more accurate, but still never go to ‘lead’ in front of the target. Also importantly - they react differently to disturbances when the gain is higher, much faster.
The physics is certainly involved in the whole process, and changes in physics, such as drawing in water, or having bigger arms or stronger muscles, can change the power law exponent, or the point in the average speed where the power law appears, etc. But adding more physical realism to the model will not help in finding controlled variables.
One thing that sort-of worked was control of phase difference (the angular separation) along with radius (distance from center). Those are two controlled variables. Then you have an oscillator that changes frequency of oscillation in proportion to the phase difference, and amplitude in proportion to radius difference. The output of the oscillator is then the reference for the position tracking system. In engineering, this is called a phase-locked loop, there are a few bits in the archives about it. Works ok, maintains size, goes a bit into lead sometimes, slows down in the corners. It is limited to ellipses, though, the delays are not very realistic, and there are some instability issues, etc, had it presented last year as a poster, but it needs more work.
For the car analogy, there is really a whole line of research, some 80 years old, on what “visual cues” and “information” drivers extract from the visual scene and use to “guide” driving. This is a beautiful paper: theory of driving perception and control (2019) pdf
It is not an exact analogy to moving hands, but there are interesting parts.