[From Rick Marken (2009.05.23.1800)]
Bruce Abbott (2009.05.20.1610 EDT)]
I’m
wondering whether the “cause does not imply correlation” issue relates
to something called a “suppressor variable” in multiple correlation.
Martin Taylor (2009.05.22.0010)
But
don’t forget the flip side of this, that the fact of a non-zero
correlation between A and B does imply either that one variable leads
to the other (is one of the possibly many influences on the other,
where influence is often labelled “causation”), or that there is
something else, X, that influences both variables. Lack or correlation
between A and B does not imply lack of influence between them, but the
existence of non-zero correlation does imply the existence of
influence, whether it is of A on B or of X on both A and B.
What you both are suggesting is that the causal path from input to output can be recovered (from the near zero correlation between input and output that is observed in a closed loop task) by taking into account a possible “suppressor” or “third” variable that influences both input and output. This is a great suggestion because, if true, it would mean that the finding of a low correlation between input and output in a closed loop task does not demonstrate Kennaway’s mantra that “causality does not imply correlation” because the input-output correlation (implied by the causal effect of input on output) could then be recovered using standard statistical techniques, such as partial correlation (a first cousin to multiple regression). So causality would imply correlation as long as you know how to find the correlation that corresponds to the causality, which involves using what is basically multiple regression (the general linear model).
So I did a little research to test this and discovered, to my great glee, that it is apparently not true; even taking a “suppressor” variable into account, causality does not imply correlation in a closed loop task. But at first it looked like you guys might be right, which threw me into a brief depression because it meant that I would have to abandon using Kennaway’s mantra as the title of my next paper. But it all turned out well in the end and I even discovered a great new way to demonstrate the behavioral illusion.
Here’s how I did my research:
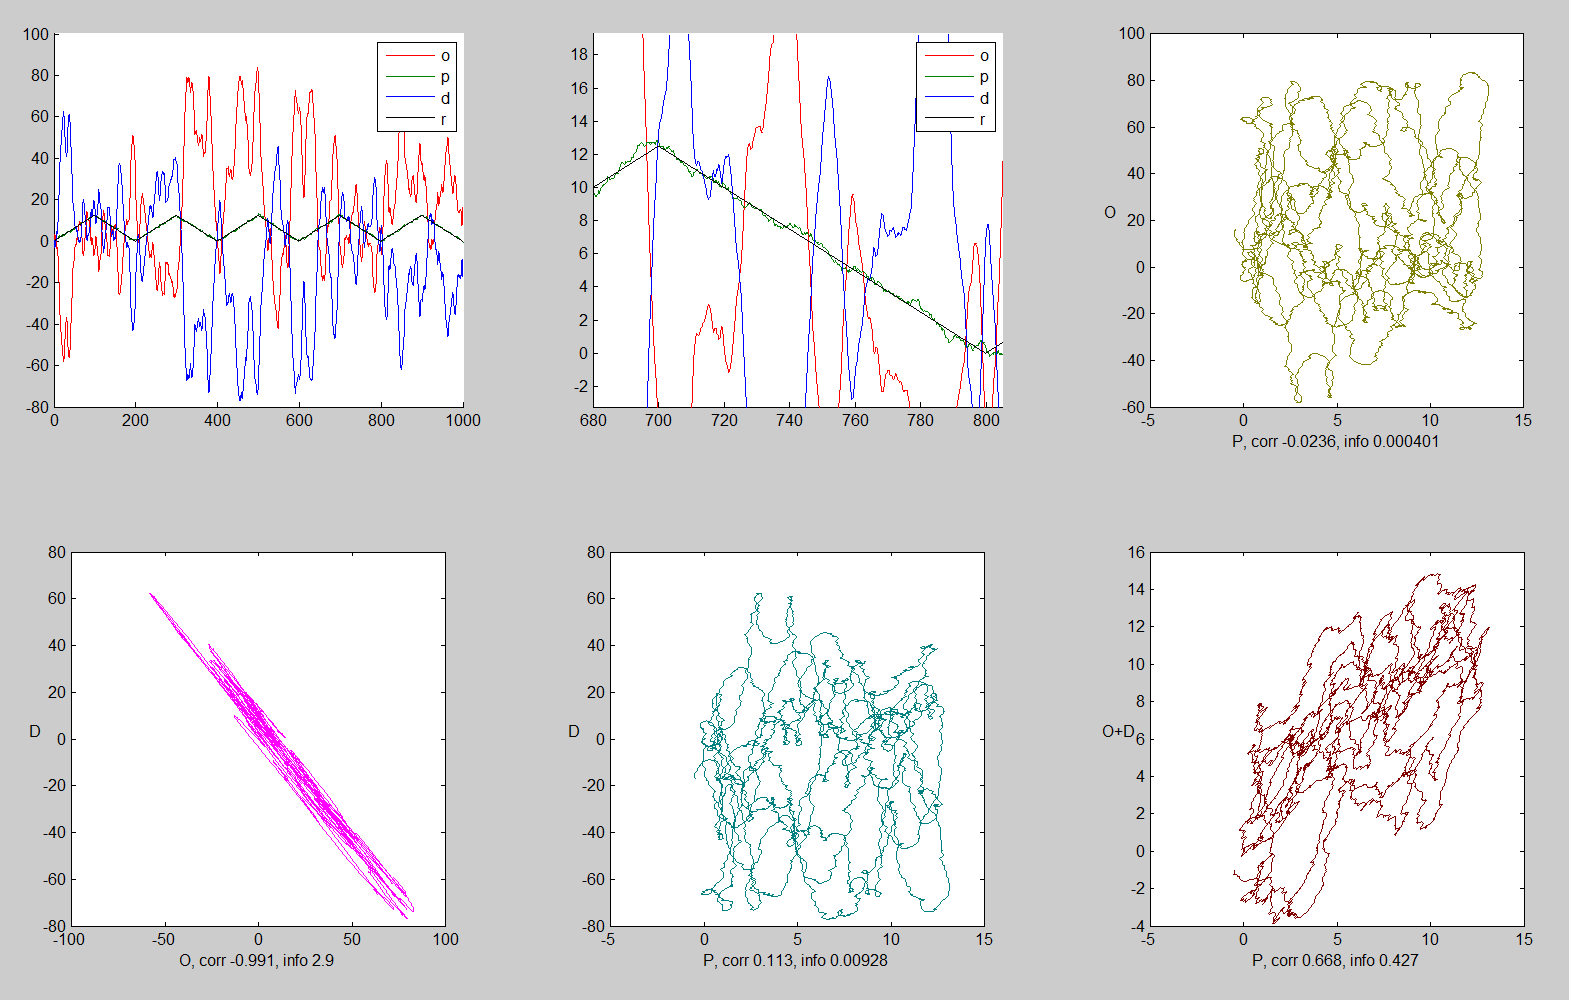
What we find in a closed-loop compensatory tracking task is the following:
r.di~0.0 r.io~0.0
d--------------->i------------->o
---------------------------------->
r.do ~-0.99
where d is the disturbance variable, i is the input variable (cursor-target) and o is the output (in my case the mouse) variable, r.di is the correlation between disturbance and input, etc. It’s that near zero correlation between i and o (r.io~0) that’s the problem. The input is all the subject can see so it must be the cause of the subjects outputs; and control theory says that it is the cause of outputs. So i and o should be highly correlated but they are not.
Bruce and Martin suggest that the problem may be a “suppressor” or “third” variable that is correlated with both i and o. The obvious possibility is d, which is correlated with both i and o. So I did a partial correlation analysis which determine what the correlation between i and o would be if d (the suppressor or third variable) were held constant. The symbol for this partial correlation is r.io|d. It’s the correlation between i and o with d held statistically “constant”.
I won’t describe the calculations for the partial correlation; there are sites on the net that will calculate it for you based no your input correlations (I used http://faculty.vassar.edu/lowry/par.html). The correlations that I put into the analysis were obtained in my “Nature of Control” compensatory tracking task (http://www.mindreadings.com/ControlDemo/BasicTrack.html). Here are the correlations from my first run:
r.io = .003
r.di = .095
r.do = -.995
The resulting partial correlation is:
r.io|d =.98
This is where I started to get depressed. The correlation goes from .003 (when the disturbance is ignored) to .98! It looks like by taking the “third” variable (d) into account, the causal relationship between i and o is revealed in the partial correlation. Before gathering my few fans around me and getting out my emergency bottle of hemlock I decided to do another run just to make sure. Here are the results:
r.io = .23
r.di = .05
r.do = -.98
As you can see, I was quite shaken so my controlling wasn’t as good this time, as evidenced by the higher r.io and lower r.do correlations. Plugging these values into the partial correlation analysis I found:
r.io|d =.91
So, again, the partial correlation analyses (“partialing out” the disturbance effect on o) seemed to pick up the causal relationship between i and o.
As I was lifting the hemlock to my lips (for some reason the one fan I could find didn’t beg me to stop) an equation appeared in my mind’s eye:
o = k (r-i)
This is the causal relationship between i and o according to PCT. What this says is that when r is constant (as it is in the tracking task) the causal relationship between i and o is negative! So I realized that the causal relationship between i and o that is “revealed” in the partial correlation is precisely the opposite of the actual causal relationship between these variables. Indeed, if the causal relationship between i and o were positive (as per the partial correlation, r.io|d) there would be no control; there would be positive feedback.
Then, dropping the bottle of hemlock and shouting “Eureka” I realized that what the partial correlation analysis was producing was a version of the behavioral illusion!! The partial correlation, r.io|d, represents the causal effect of o on i, which is positive linear, not the causal effect of i on o, which is negative (and not necessarily linear).
At least this is what I think is going on. This is where Richard Kennaway comes in. I think I need a proof that the partial correlation, r.io|d, is actually a representation of the causal link from o to i (the feedback connection i = g(o)) and not a representation of the causal link from i to o.
I bet these results turn on the fact that i and o are in a closed loop: i causes o and o causes i. But all we observe with correlation is the relationship between i and o. The partial correlation analysis is based on the general linear model which, in this case, assumes:
o = k1 i + k2 d
Partial correlation solves for k1, which is equivalent to r.io|d. So the analysis assumes one way causality. But in the tracking task there is circular causality. So when this open-loop causal analysis is applied to a closed-loop situation, the result is a version of the behavioral illusion: the observed k1 (which is r.io|d) does not reflect the causal connection from i to o (as is implied by the formula) but, rather, the causal connection from o to i (which this analysis assumes does not exist).
I think if Richard Kennaway can come up with a nice, simple (so I can understand it) analysis of what’s going on here it would make a great paper entitled: Causation Does Not Imply Correlation. Because that’s what’s going on here. The negative causative connection from i to o does not show up in the observed correlation between i and o, even when d is “partialled out” (in which case what shows up is a positive correlation reflecting the causal connection between o and i). The idea would be to show that statistical models, like the general linear model, which assume an open loop connection between variables, gives misleading results when applied to an analysis of behavioral variables that occur in a closed loop of causation.
Best regards
Rick
···
–
Richard S. Marken PhD
rsmarken@gmail.com