'centralization index' does not measure tongue position

In Collective control as a real-world phenomenon (in Phenomena/Collective Phenomena) I posted this correction of fact:

I said I would post more detail here.

The centralization index is a measure of the relationship between two features of acoustic perception, greater intensity of acoustic energy at different frequency bands called formants. The procedure described in The Social Motivation of a Sound Change started with making acoustic spectrograms of eighty instances of diphthongs recorded from the speech of seven speakers.

A sound spectrogram is a graph with time on the x axis and rising frequency on the y axis. Sound energy falls in bands called formants. Frequency of the first formant F1 corresponds to the open-close dimension of vowel articulation (a is open, higher F1, i and u are close, lower F1). Frequency of the second formant F2 corresponds to the front-back dimension of vowel articulation (i is front, high F2, u is back, low F2). Front/back and high/low are articulatory values describing the presumed but not so often measured configuration of the tongue.

In these sound spectrograms of diphthongs, which glide from one vowel sound to another, the first formant describes a rising and falling curve, and the point of its maximum frequency was chosen to measure centralization.

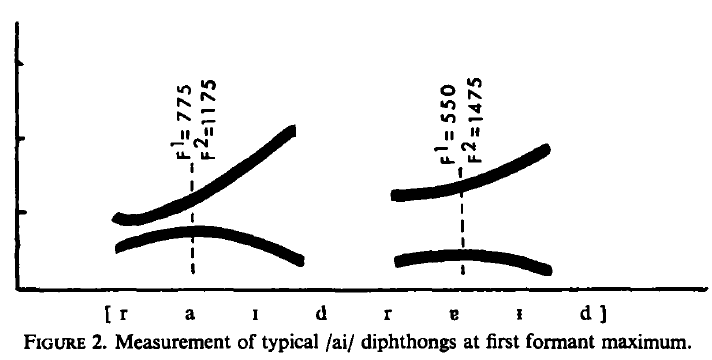
This is the first vowel of the ai diphthong (as in ‘wife’), and you see F2 rising after it. If it were the same vowel but in the au diphthong F2 would not rise after it.

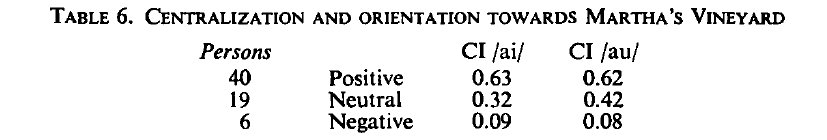
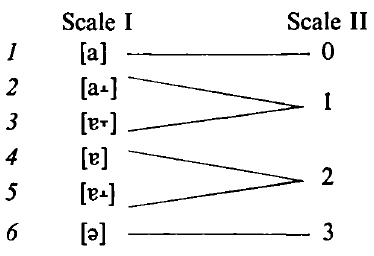
The relationship between peak F1 frequency and F2 frequency at that point in time, plotted on a bi-logarithmic scale, correlated with subjective (phonetically trained) impressions of vowel quality in six degrees. Two pairs were not so clearly differentiated, so this was reduced to a scale of four degrees of centralization ranging from [a] to [?].

image

Obviously tongue position is not an imitable perceptual variable, being imperceptible inside the other speaker’s mouth. From the above, it may be seen that if the ‘centralization index’ had been a perceptual variable for the speakers in question it was not a simple perception; it is derivative of a relationship between frequencies of sound.

Experimentally, when we hear paired buzzing sounds of appropriately varying frequencies we hear speech sounds, whereas separately we hear only buzzing sounds, so clearly we have input functions that perceive vowel quality, and other functions that correlate these perceptions with the mouth-feel that produces them.

The scale above is a continuum. The differentiation into six and then four grades is a convenient artifact that Bill (Labov) could control. All that the speakers with established identity were doing was sounding “normal”, or in the case of adolescents establishing their identity, sounding “like these folks” and “not like those folks”.

In the 19th century only the au diphthong was centralized. This is a sometimes mocked stereotype of Canadian speech. In the 20th century, but prior to Labov’s visits, successive cohorts of adolescents had each tended to overshoot the mark, with a result that the first vowel of the ai diphthong was centralized as well. This is the sound change to which the title of his paper refers as having a social motivation.

That people tend to speak like those with whom they most speak is not a finding, it is a commonplace. Modeling Labov’s actual finding would be of value, but rather challenging.

Right, it’s not a finding, it is an assumption of a control model that accounts for Labov’s data – the observed phenomenon of the development of regional dialects.

Apparently my work has nothing to do with your (and virtually everyone else here’s) understanding of PCT. I guess I should be glad that I’m even allowed to post here…so far;-)

Rick, it has nothing to do with understanding PCT. Everybody in this discussion understands PCT. It has to do with understanding the phenomenon to be modeled.

You’re ignoring the phenomenon on which Labov reported and the social basis of that phenomenon which his research disclosed.

The “socially motivated sound change” (q.v. that phrase in the title) introduced an anomalous sound that had not previously been in the speech of this region. It was not acquired by imitating how others speak; others had not been speaking that way. Your repackaging of the CROWD demo with a claim that proximity yields like speech sounds does not model this.

I disagree, of course;-) It’s about how PCT modeling (and science) is done. It’s done by fitting models to data.

I was focusing on one phenomenon that was clear in the data; the differences in average pronunciation across differnet locations. The same model would have applied to the differences across social class.

The only data I saw that could could easily be modeled was the data on pronunciation differences across different regions and social class. I picked regions as the data to model but I could have done it on social class as well. The principles of the model would apply to both.

It was not a repackaging of the CROWD model. CROWD doesn’t control for imitating; it controls for following and avoiding obstacles. Mine controls for imitating the pronunciation of the person your speaking to. And the results of the modeling were quite interesting; it showed that the average pronunciation of two separated groups that initially pronounced the same way fairly quickly come to different steady state values (see Figure 7.2 in The Study of Living Control Systems). What I didn’t show in that Figure that was also very intersting is that these pronumciation averages can spontaneously change to new steady state values after a while. So the model makes an interesting prediction about the time course of pronunciation changes in isolated communities; the changes are predicted to be “punctuated” rather than gradual.

The phenomenon that is the topic of the paper is not determined by location or social class. It is determined by esteem, individual adolescents controlling to sound like the kind of person that they want to be perceived as. A “kind of person” is a collectively controlled perception. Some kids who lived and/or worked in a down-Island location made the “I am an Islander” choice and spoke accordingly. Some kids who lived and/or worked in a up-Island location made the “I’m getting off the rock” choice and spoke accordingly.

The ‘other’ identity is summer visitors from New York, Boston, and other places where dialect features from London and Kent had supplanted the older dialect features in the 18th and 19th centuries. Your model could be a first approximation to data about the spread of that dialect, and the beginnings of such spread among some but not all Islanders in the down-Island towns especially. But that is not the topic phenomenon.

There are other acoustic features. People are well aware of postvocalic r (absent or a tenuous diphthong in Bahston and Nyuw Yawk), and because it is in awareness that feature may function as a shibboleth on occasion (like talk of being “in Martha’s Vineyard” or going to “Oaks Bluff”).

Speakers were (and are) unaware of the centralized first mora of diphthongs. That’s why he chose that feature, whereas prominence of a shibboleth like postvocalic r could influence speakers to heighten gain on their control of it. Likewise, the data come from recordings of interviews on innocuous topics that have nothing to do with the social issues or speech differences.

Yes that is interesting. It contradicts linguistic data about sound change, which is generally characterized as ‘drift’. So it seems to be a defect of the model. The change in an individual speaker can be much faster, but not population changes. This is consistent with the observation that these changes are largely associated with establishment of social identity in adolescence. Older adults adapt conversationally but don’t change their social identity much, with its associated reference values, and younger kids are with one another and with adults mostly rather than with cohorts of teenagers, so there’s a kind of ballast.

Another huge gap is that there is no model of imitation. For starters, that requires comparing perceptions of one’s own productions with perceptions of other’s productions. It’s just a magical property in your model.

The topic of research done in the context of the current, causal paradigm shouldn’t divert us from analyzing existing data from the perspective of the control paradigm, when possible. The power law research is a good example of this. From the perceptive of the causal paradigm, the goal of this research is to determine what causes the power law relationship between the velocity and curvature of movement. From the perceptive of the PCT paradigm, the goal of research is to determine how the power law relates to the controlling that organisms are doing.

Powers’ analysis of Verhave’s shock avoidance research is another good example of using research done from the perspective of the causal paradigm to test a theory (PCT) based on the control paradigm. Verhave, working from the perspective of the causal paradigm was studying the effect of shock schedules on the level of operant behavior. Powers, working from the perspective of the control paradigm, saw in Verhave’s data the possibility of analyzing it in terms of determining the variables the rats were controlling.

Labov may have been studying how pronunciation is “determined by esteem” but the only data in his study that was amenable to testing from the perspective of the control paradigm was the average CI index in different groups. I picked the data on groups defined by geographic proximity since these groups are probably the ones where the members were most often interacting with each other.

In fact there was no magic. The model did exacly what you say it didn’t: it compared perceptions of each individual’s own productions with the perceptions of others. Here’s the relevant description of the model from The Study of Living Control Systems (p. 109):

“Interactions between members of the each sub-population consisted of pairs of members controlling for imitating the pronunciation (CI value) of the other. They did this by varying their output (vocal production) so that their own pronunciation approaches that of the other party to the interaction. That is, each member was acting so as to move their own CI value toward that of the member with whom they were currently interacting”.

So your program represents several variables for each agent, including:

  1. CI-p: Their perception of their own vocal production.
  2. CI-r: Their reference value for that perception of their own vocal production.
  3. CI-v: Their own vocal production.
  4. CI-o: Their perceptions of other agents’ vocal production.

CI-p and CI-v must be distinct, since a living control system cannot perceive another’s perceptions.

Your program has a comparator computing the difference between CI-p and CI-r, producing an error signal which affects the value of CI-v within a range set by other means (other control loops in vivo).

Your program has a comparator computing the difference between CI-p and CI-o, producing an error signal which affects the value of CI-r.

Is this true?

Assuming that it is, there is the difficulty (for you) that the variable that correlates best with differences in CI does not entail frequent proximity or frequent conversation. It is not region (up- or down-Island). Nor is it social class. Here’s a clue (p. 298):

Chilmarkers pride themselves on their differences from mainlanders:
[illustration elided]
It is not unnatural, then, to find phonetic differences becoming stronger
and stronger as the group fights to maintain its identity. We have mentioned
earlier that the degrees of retroflexion in final and pre-consonantal fr/ have
social significance: at Chilmark, retroflexion is at its strongest, and is
steadily increasing among the younger boys.

On that same page, we see that the highest CI index is among fishermen, 1/3 of whom were in Edgartown, a quintessentially down-Island town.

On p. 297 of the paper, we read:

A study of the data shows that high centralization of /ai/ and
/au/ is closely correlated with expressions of strong resistance to the incursions
of the summer people.

In speech, this resistance manifests as speaking differently from them, resisting the tendency (which we have agreeably postulated) to speak like those you are speaking with.

On p. 306 of the paper we read:

In summary, we can then say that the meaning of centralization, judging
from the context in which it occurs, is positive orientation towards Martha’s
Vineyard. If we now overlook age level, occupation, ethnic group, geography,
and study the relationship of centralization to this one independent
variable, we can confirm or reject this conclusion. An examination of the
total interview for each informant allows us to place him in one of three
categories: positive-expresses definitely positive feelings towards Martha’s
Vineyard; neutral-expresses neither positive nor negative feelings towards
Martha’s Vineyard; negative-indicates desire to live elsewhere. When
these three groups are rated for mean centralization indexes, we obtain the
striking result of Table 6.

The fact that this table shows us the sharpest example of stratification we
have yet seen, indicates that we have come reasonably close to a valid explanation
of the social distribution of centralized diphthongs.

These are the data to be modeled. “Orientation toward Martha’s Vineyard” reflects fairly high-level perceptual variables. I have substituted lower-level values amenable to modeling speech phenomena: perceptions of two socially identified (=collectively controlled) ‘kinds of speaking’, that of Islanders and that of ‘others’, and control to approximate one and avoid the other. I abbreviated this in the word “esteem”. This is part of a larger constellation of collectively controlled variables under the general rubric of social identity.

Absolutely agree.

I don’t see how CI-p and CI-v differ. In my model, agents control (CI-p - CI-o) relative to a reference of 0.

No, mine is actually a two level model. The highest level controls for imitation by acting to keep (CI-p - CI-o) at a reference of 0. The output of this control system is actually the reference for Cl-p, which in your notation is CI-r.

There are many possible “difficulties” for the model. It’s a very simple model based on very limited data. Many assumptions are made in applying the model, which is that people tend to interact entirely with only members who live in the same geographical region (almost certainly not true). The next step in this research, if anyone were really interested in testing the model, would be to get data on, among other things, frequency of interaction between members of the all these different groups into which Labov divided the data.

This is speculation; I doubt that anyone has ever seen people fighting for their identity using pronunciation. However, there is a way to make this a testable alternative explanation of the average pronunciation difference in different groups. The hypothesis would be that groups maintain a perception of their identity by pronouncing words the way others of their identity pronouce them. It’s still an imitation model but with a still higher order control system that identifies who you will imitate. In order to test this model we would need data on who people identifiy as of the same identity and how often they interact with those people.

Unless you believe, as Labov does, that these data show that “attitude toward Martha’s Vinyard” is the main determinant of (i.e. causes) CI index, these data should be treated with caution. The CI index for the Negatives is much lower than that of any of the other groups. Maybe they are new to the island or just never mix with others. The other CIs are consistent with those of other groups so it’s possible that some of this might be explained by the overlap of Positives and Neutrals with the geographical distribuion of the respondants.

I think the way to proceed with this research, if you want to do research from a PCT perspective.is to take the imitation model as a starting point and then begin collecting data to further test the model; I think we’ve gone as far as we can go with the data from the Labov paper – which was clearly collected in the context of the causal paradigm, which is certainly not criticism of Labov; there was no other paradigm around when he did the research and it’s a nice piece of work from the point of view of that paradigm.