[From Rick Marken (2010.12.05.1425)]
Martin Taylor (2010.12.05.12.49)–
One of the wisest things told me by a professor in Grad School was
that if two schools of thought contend strongly, it is very likely
that both are right and that both are wrong.
Doesn’t sound all that wise to me. My kind of wise professor would have said that if two schools of thought contend strongly both may be wrong (in the cosmic sense) but one is more right than the other. And the one that is more right can be determined by testing the predictions of each “school of thought” against data.
Their rightness and
wrongness will probably be reconciled by looking at the issue from
another direction.
No, I think rightness and wrongness is determined by comparing predictions against data. Are the flat vs round earth schools of thought “reconcilable” by looking at the “shape of the earth” issue from a different perspective? I don’t think so. The round earth school is “more right”, though, of course, not absolutely right (it’s an oblate spheroid; and even that is not “right”).
Isn't that what PCT is, a quite different
direction from which to look at psychology?
No, PCT is an alternate model of behavior. If PCT is right (or more right) then other models of behavior are wrong.
Don't you advocate using
PCT to look at economics from another direction?
No, I advocate using PCT as a model of economic behavior. An alternative to utility and rational actor models.
When I read your ideological writings, I agree with them almost
entirely. When I read Martin L’s, his logic seems reasonable, even
though his premises grate upon my sensibilities. I don’t like to
think that the world might be as he thinks it is, but I cannot
demonstrate to myself that he is wrong. So I would like to gather
data, and he offered some, which I would like to see.
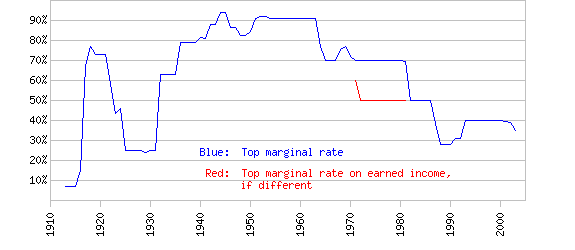
I have offered a ton of data that show that his model of the economy is wrong. I’ve shown that increases in the top marginal tax rate are positively related to growth and negatively related to unemployment rate. I have shown that growth precedes investment, not vice versa. I have data that show that revenue increases as top marginal tax rates increase (counter to those who believe that revenue actually increases when tax rates are lowered). I have data that shows that unemployment is always higher at the end of Republican regimes than it was at the beginning and exactly the opposite for Democratic regimes. Every macro economic free market myth is contradicted by the data. Reconcile all you want but I’m currently leaning toward free market economic theories being wrong.
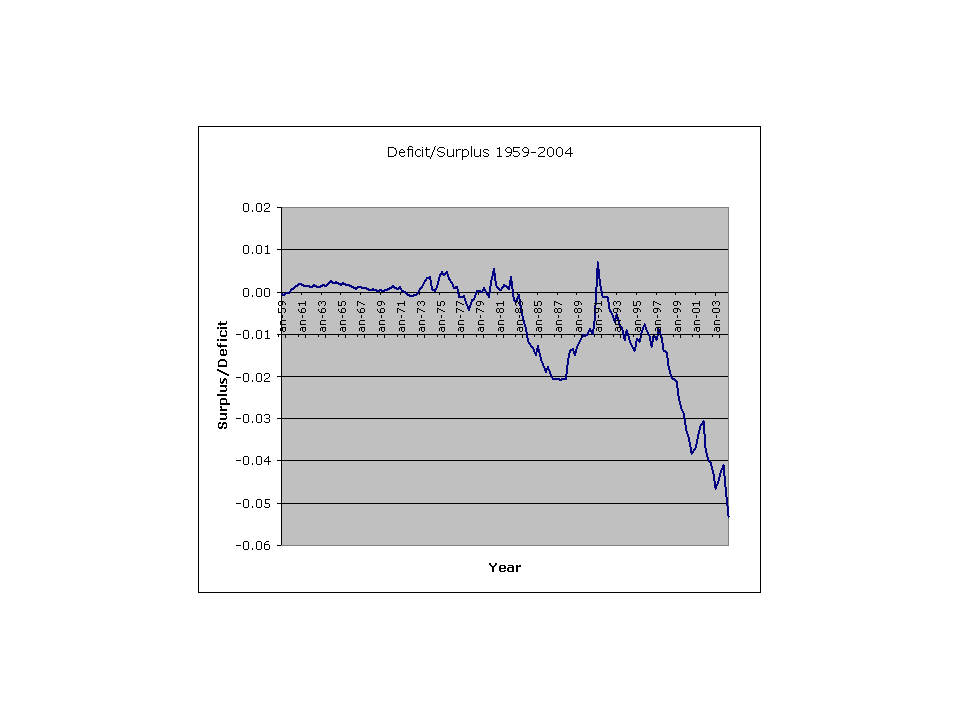
In the combined graph that I put together for you, I don't see what
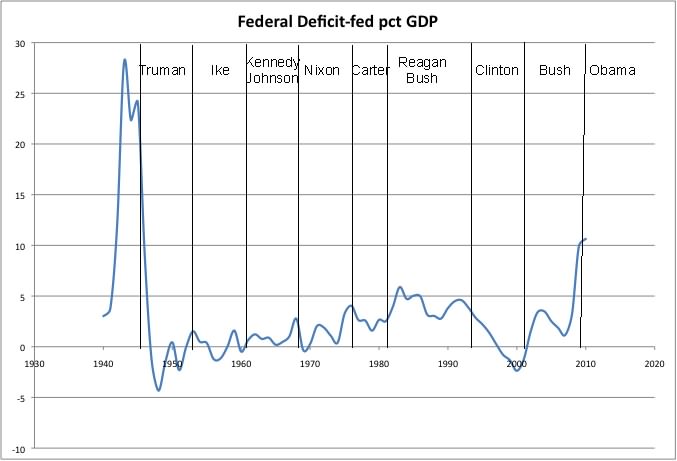
conclusions you can reliably draw. The debt/GDP ratio dropped when
the wealth disparity was relatively low after WWII, but it also
dropped during the Clinton years, when the wealth disparity was high
and rising fast.
A better graph would have shown deficit (as a proportion of GDP) rather than debt. The deficit was rather constant before 1980 because the top tax rate was high (as high as 90% for a while). The deficit takes off in 1980 along with wealth discrepancy. The fact that wealth disparity was growing fast during the Clinton years is sort of surprising, but the fact is that tax rates (by historical standards) were still ridiculously low so even though Clinton raised rates enough to reduce the deficit, they were apparently not high enough to reduce wealth disparity.
I can't make a connection between the two, looking
at those graphs. A graph of the slope of the marginal tax rate
(averaged over states) versus taxable income would be interesting to
compare with both those graphs. So would a graph of capital
investment as a proportion of GDP over the same time period.
I’ve got all those data. It’s mainly the tax rates that kept the disparity low after the great depression. Once the tax rates went down, the disparity came up.
I posted the debt/GDP graph mainly to suggest that the current
hysteria over disastrous debt levels is probably unwarranted, since
the situation was dramatically worse half a century ago.
Yes, that’s when the country believed that the rich should pay their fair share for things like wars. We don’t believe that anymore. The Laffers of the world have won and they must be Laffing their heads off.
A look at
the differences in money-related policies in those years as compared
to recent years might suggest some clues as to how best to proceed.
Did they have a more progressive taxation pattern?
Yes, to an astounding degree more progressive.
Did they invest
more in public works such as the Interstate System? Were the effects
equably distributed across the States? Etc. Etc.
I haven’t looked at that data. I have looked at government spending over the years and it has increased at a pretty constant rate. There have only been rather small changes in spending. I did find that the recent meme that says that spending went crazy when Obama came in (or when the Dems took the House in 2008) is just another right wing myth. Spending actually decreased slightly during Obama’s first 2 years. It remained virtually constant when the Dem’s took the House with a small blip of an increase in 2007. The biggest increases in government spending (recently) happened in 1994, when the Rethugs took over the House, and in 2002, when the Rethugs controlled all branches of government.
When we get the data, and when we have a PCT-based theory, then will
be the time to see whether the data are predictable from theory. You
keep on about how your lagged correlations don’t conform to
conventional economic theory. Are they predictable from PCT?
I have a model that could be made to predict them, with the appropriate assumptions about changes in the unmeasurable disturbance known as leakage. But for now I’m just content to let the data show that conventional macroeconomic theory is clearly wrong and admit that I myself have no detailed working model that will account for all that data…yet.
I have an ideological view closely aligned with yours. Martin L's
view is different. The ideologies may clash, but isn’t it possible
that both are right and both are wrong?
The ideologies are neither right nor wrong. They are untestable. It’s the models of the economy that can be right or wrong. Martin L.'s model of the economy is wrong since it predict things that are contradicted by data.
How could we tell, other
than by seeing whether theories based on either actually can be used
to predict the data?
I don’t believe that theories should be based on ideologies. Martin L. has already told us the prediction of his theory. I don’t know how he comes up with them but they are wrong. So where we are right now is: we have no good theory of the economy. But we do have a lot of macro economic data that can inform our decisions about policy. I know that’s a very primitive basis for formulating policy but I think it’s better than doing it based on a theory that makes all the wrong predictions.
If it turns out that they both predict the same
consequences of a given policy change, then whether to implement
that policy depends on whether your ideological bias says that the
change would be for the better or for the worse.
But they don’t make the same predictions.
That's the time for
ideology to come into play, not when we are trying to figure out how
the economy actually works (using PCT, with any luck).
If by “ideology” you mean preferences for the state of the world then those will always come into play when implementing policy.
Best
Rick
···
–
Richard S. Marken PhD
rsmarken@gmail.com
www.mindreadings.com