[From
Bjorn Simonsen (2004.02.23,17:30 EuST)]
[From
Rick Marken (2004.02.21.0930)]
[From
Rick Marken (2004.02.22.1040)]
Could you do me a favour and send me
(in a spreadsheet) the Norwegian data on gross
private investment and growth in GDP (or GNP) going back as far as you can go.
(I got back to 19653). I used quarterly data but I’ll take what I can get. What
I
would like is real (not inflation adjusted) GDP (or GNP), inflation adjusted
GDP (or GNP)
and real (not inflation adjusted) gross private investment (I don’t think they
report
inflation adjusted investment, I presume because they assume it will be
measured
as a proportion of GNP, which would also have to be in real dollars). If you
can get
me gross government investment as well that would be great (in the US they
report
defence and domestic investment as separate parts of government investment).
I
send you private the spreadsheets-You will find 1) The Norwegian data Grossed
fixed capital formation at current price, Ip, General government
investment (Ig), and the GDP. The data is partial quarterly data and yearly
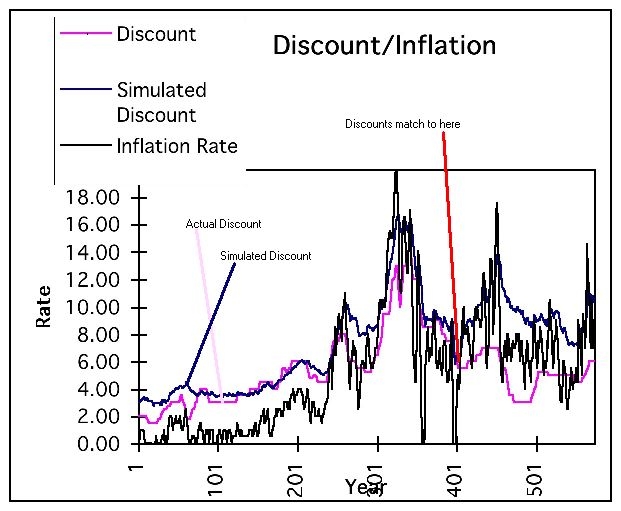
data. And 2) a Norwegian CPI table 3) A Simulated Change in Discount and
Correlation coefficients and 4) An Analysis of Norwegian Discount relative to
CPI.
If
any other is interested, give me a mail
I
don’t know if it is
.
…a wonderful birthday present (my birthday is next Saturday, 2/28).
But,
Happy Birthday. I shall have my birthday on Friday 2/27, and I leave the same
day for our cottage in the mountain.
I am back again Monday.
Did you do these calculations using
Visual Basic? In my calculations, the value of
sim_discount that is used in the
calculation of p is the value of output calculated
on the prior iteration of the following
loop (lines stating with an apostrophe are remarks.
If
you go to 3) A Simulated Change in Discount and Correlation coefficients and
4) An Analysis of Norwegian
Discount relative to CPI you will see that the calculations are very simple. I
have just made the formulas in a cell and dragged the Cell in accordance to the
CPI and the date columns. You will understand when you open the spreadsheets.
I
know you use Visual Basic, but I think functions in the spreadsheet also work
well.
If
you look at 3) A Simulated Change in Discount and Correlation coefficients you
see I still get the correlation coefficient like 1. In the same spreadsheet you
will see that I have not used your formula for the output
F16+0.01*(8*(0-(F16-C15))-F16),
I have used = F16+$D$8*($D$9*($D$10-(F16-C15))-F16).
I
have substituted 0.01 with $D$8 and substituted 8 with $D$9 and your reference
0 with $D$10. This is Simply and
you have maybe done it yourself. I thought it was exciting having a Simulated
Discount graph and changing the values in D8, D9 and/or D10. Then I could see
how the graph changed when I clicked F9.
I
didn’t understand your comments about my correlation coefficient =1.00. If you
see a mistake, please tell me.
I
did the same wit the US Simulated Discount data. And I got the Correlation
coefficient almost =1.00 also there.
I see that you did do an analysis of
Federal Gross Investment and Discount Rate
(something I did not do). Was this for the
Norwegian data? If so, then you can
apparently get the data I want: Norwegian
Gross Federal and Gross Private
Investment as well as Norwegian Real and
Inflation Adjusted GDP.
I
did it also with the US data. I send it to you as 5) US Investment relative to
Discount
bjorn
···