[From Rick Marken (2004.09.11.1910)]
One of the things I've heard in this election year is that the problems that exist in the current economy (such as the growing deficit) are not the result of current policies but are, rather, the delayed result of the policies of an earlier administration or the result of Sept. 11 (the sad anniversary of which we commemorate today). Here is some data which suggest that, in the case of the budget deficit at least, neither of these explanations work. They also show, I believe, that the time lag between a change in policy a resulting change in the behavior of an aggregate economic variable (like the deficit) can be on the order of months or even weeks rather than years.
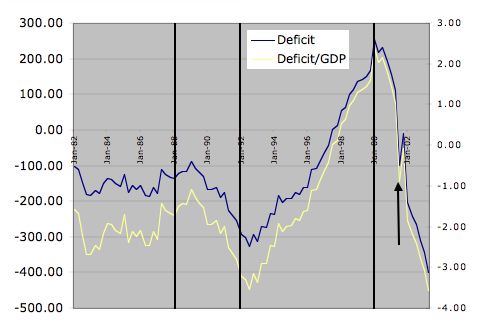
In the graph below I show the deficit (and surplus) in each quarter starting in January 1982. The deficit (surplus) is plotted as an absolute value (blue line) or as a fraction of GDP (yellow line). The results are essentially the same in both cases so I'll just refer to the absolute deficit (blue line). The bold vertical lines are transitions between administrations: 1988 is the transition from Reagan to Bush I, 1992 is the transition from Bush I to Clinton and 2000 is the transition from Clinton to Bush II. The up arrow points at Sept. 11.
As you can see, there is a clear change in the trend of the deficit line at the change of each administration. The deficit had been pretty constant through the last 6 years of Reagan's term. About a year after the start of Bush I there is a steady increase in the deficit. Less than a year after Clinton takes office the deficit starts decreasing, ending up in surplus by 1998. The surplus keeps increasing until the end of Clinton's term. Less than a year after Bush II takes over the decline back into deficit begins. The surplus is erased months before Sept. 11, so the deficit was not much impacted by that tragic, horrible event. Indeed, there is a brief reduction in the deficit immediately after Sept. 11, which is then followed by a continuation of the deficit's precipitous increase (indicated by the drop in the trend line on the graph).
What is interesting (to me) about this graph is that the inflection points in the deficit trend line correspond closely to changes in administrations. The deficit trend during the last six years of the Reagan era is relatively flat. The deficit trend through the 4 year Bush I era is nearly linear with negative slope. The deficit trend through the 8 year Clinton era is nearly linear with positive slope and the deficit trend through the 3+ years of the Bush II era is nearly linear with very negative slope.
It seems to me that it would be stretch to blame the deficit trend in the 3+ years of Bush II, for example, on the policies of the 8 years of Clinton. It seems like just too much of a coincidence to me that the trend would be positively linear throughout the entire 8 years of Clinton and then, suddenly, change course when Bush II happened to come in. Same with the negative trend in Bush I; it seems to much of a coincidence to blame this on the previous 8 years of Reagan since the trend changes almost immediately after Reagan leaves office and remains linear negative until Clinton comes in.
It looks to me like the steady linear decrease in the deficit during the Clinton era started almost immediately after the tax increase was passed in 1993. Similarly, the increase in the deficit during the Bush II era seems to have begun right after the first tax cut. So it looks to me like policy changes can result in changes in the trend of economic variables very quickly.
Best regards
Rick