[From Bill Powers (2008.12.19.1613 MST)]
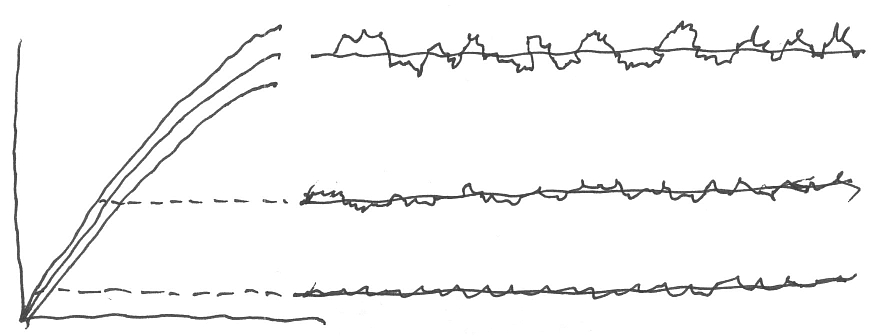
Back again. Here is a scan of a drawing showing how I imagine the
situation to be:
SIGNAL
AXIS
LIGHT
AXIS
TIME —>
The center curve on the left shows how steady-state impulse rate will
increase as steady-state light intensity increases. The two flanking
curves indicate a +/- 1 Standard Deviation band within which 68.3% of
instantaneous readings will be found. Measuring my drawing, I see that
the ratio of SD to signal magnitude at the top of the plot is 12.5%
instead of the 10% given in the paper, but that’s close enough.
The three time plots show how the light signal would look when recorded
against time for three levels of constant light intensity. If S is the
signal strength and delta is the standard deviation, both measured in
impulses per second, the interspike interval would range between
1/(S+delta) and 1/(S-delta).
We can assume that the standard deviation is 10% of the signal as shown
in the Thorson & Thorson paper. From Fig. 2 we can read a maximum
signal strength of 18 impulses per second for a light-modulation
frequency of 1.5 Hz, and the standard deviation would be 1.8 impulses per
second assuming a constant signal-to-noise ratio at all brightnesses
(again, close enough for this sketch of a method). For the maximum light
intensity, the minimum spacing between impulses would be 1/(18 + 1.8) or
0.0505 sec and the maximum would be (1/(18 - 1.8) or 0.0617 sec. 68% of
all readings would be between these two limits.
At half the maximum light intensity, the two limits would be 0.101 and
0.123 sec.
As nearly as I can work it out, these are the figures that Martin should
use in calculating the probabilities. At 1.5 Hz, the waveform spends
0.125 sec in each of the 12 bins, and if the duration of the trial is 14
sec (it’s a little hard to figure out from the text), that means 9.3
cycles in the whole trial or a total sample time of 1.2 sec for each bin,
for the 1.5 Hz case.
Note that at 0.07 Hz there is is just one cycle of light intensity during
a 14-sec trial, and 1/12 of that gives 1.17 sec integration time per bin.
So the integration times per bin are quite similar at the two
frequencies.
These are all very rough figures and need to be refined to agree with the
data. The above just shows the strategy as I see it for figuring out the
probability per sample of an interval between the lower and upper limits.
I assume this is the basic data needed to do the informational
analysis.
Note that the signal-to-noise ratio is around 10:1. Fluctuations of light
intensity of 10% RMS are noticeable but in a moving scene would probably
be undetected. I think this leaves us much closer to the idea that
perceptual signals have low noise levels even when we speak of the neural
signals themselves.
In Limulus, of course. The next time I’m on Cape Cod, I’ll go to the
beach and ask one of these trilobites about it. They are very
ancient-looking animals.
Best,
Bill P.