[From Bill Powers (2008.12.14.1014 MST)]
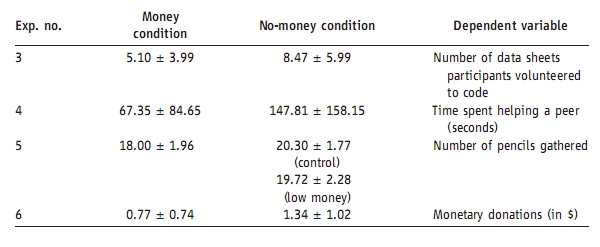
I was looking back through that Science article, The Psychological
Consequences of Money (Vohs et. al), and picked up on something I had
missed the first time. This table shows the results from 4 of the
experiments:
Check me out on this:
Condition Range (+/- 1 Standard deviation)
Data sheets coded (within 1 standard deviation)
Money 1.11 …
9.09
No-money 2.48 … 14.46
Time spent helping peer
Money -17.30 … 152.00
No-Money -10.34 … 305.96
Number pencils gathered
Money 16.04 … 19.96
No-Money 18.53 … 22.07
Control 17.44 … 22.00
Monetary donations
Money 0.03 …
1.51
No-Money 0.32 … 2.36
This doesn’t quite answer my question (how many individuals showed the
effect, how many didn’t?) but it does indicate that the distributions of
Money and No-Money conditions had a very large overlap. I don’t know how
to translate this into probability of a correct prediction for each
condition, but it’s certainly not very high. The theoretical probability
don’t mean much since the distributions are probably not purely Gaussian,
but given the individual scores, which are meaningful for these four
conditions, we could determine the probabilities directly.
It seems to me that anyone who uses this study to make predictions about
individuals would be vitally interested in knowing whether the
predictions are believable. My first impression from the above data is
that a prediction about the effect of exposure to money on any
individual’s behavior could easily be lower than chance – in other
words, probably wrong. It all depends on whether a few individuals
contributed large amounts to the mean. If a few of them account for most
of the deviations on the plus side, it’s possible that the majority of
subjects showed no effect or the opposite effect. If that is true, using
these findings to predict what an individual would do would lead mostly
to incorrect predictions (predictions in the wrong direction).
Best,
Bill P.
···
[From Kenny Kitzke (2008.12.15)]
Bill, your frustration with conclusions from studies like the one below is well-justified. I have dealt with this for decades in clients who perform employee surveys. They misuse data and often draw wrong or inconsequential conclusions. Then, they formulate improvement plans (new actions or policies) which may produce few intended results or even make things worse. Then, the biggest joke of all, they sometimes conclude they did not take enough action and double their faulty stratagies. As you well know, instead of using the survey as a negative feedback loop, it is turned into a positive feedback loop.
There are a number of mathematical gremlins in their survey methods:
- They use population statistics, like the mean and standard deviation (though most just use the mean), to make decisions about how to change the attitudes or satisfaction of individuals. One CEO boasted to me just last week how they concentrated on the issues where the mean had fallen most since the last survey to find the best improvement opportunities.
- They insist the surveys are voluntary and anonymous. Even their HR consultants seem to misunderstand the uncertainty and possible error these “protocols” introduce into the data and the conclusions they reach. It is the blind leading the blind. Few HR executives have any statistical knowledge, so their consultants can easily “snow” them with there confidence intervals, tests of significance, etc.
So, you are right, the meaningful data for individual relevance are the frequency distributions, not the statistical measures of central tendency or spread. I am pleased to say that a few CEO’s seemed to grasp that the best way to measure employee satisfaction and improvement is through the one-on-one interaction between the employee and their superior. This is where I think PCT and MOL can give the managers effective tools to assess and improve the satisfaction of the employees with their employment. Hopefully, next year, they can get better data, draw more accurate conclusions, be more effective at getting approval from their bosses for relevant change actions, and measure subsequent improved results.
I have not tried to follow this example as I am suspicious of the relationship between an individual’s attitude toward “money” and the economy. But, I hope my observations support your trust of this study or what it suggests should be done to improve the economy.
[From Bill Powers (2008.12.14.1014 MST)]
In a message dated 12/14/2008 1:07:47 P.M. Eastern Standard Time, powers_w@FRONTIER.NET writes:

···
[From Bill Powers (2008.12.14.1014 MST)]
I was looking back through that Science article, The Psychological Consequences of Money (Vohs et. al), and picked up on something I had missed the first time. This table shows the results from 4 of the experiments:
![Emacs!]()
Check me out on this:
Condition Range (+/- 1 Standard deviation)
           Data sheets coded (within 1 standard deviation)
Money      1.11 ...    9.09
No-money   2.48 ...   14.46

           Time spent helping peer
Money     -17.30 ... 152.00
No-Money  -10.34 ... 305.96

           Number pencils gathered
Money      16.04 ...  19.96
No-Money 18.53 … 22.07
Control 17.44 … 22.00
            Monetary donations
Money      0.03 ...    1.51
No-Money   0.32 ...    2.36
This doesn’t quite answer my question (how many individuals showed the effect, how many didn’t?) but it does indicate that the distributions of Money and No-Money conditions had a very large overlap. I don’t know how to translate this into probability of a correct prediction for each condition, but it’s certainly not very high. The theoretical probability don’t mean much since the distributions are probably not purely Gaussian, but given the individual scores, which are meaningful for these four conditions, we could determine the probabilities directly.
It seems to me that anyone who uses this study to make predictions about individuals would be vitally interested in knowing whether the predictions are believable. My first impression from the above data is that a prediction about the effect of exposure to money on any individual’s behavior could easily be lower than chance – in other words, probably wrong. It all depends on whether a few individuals contributed large amounts to the mean. If a few of them account for most of the deviations on the plus side, it’s possible that the majority of subjects showed no effect or the opposite effect. If that is true, using these findings to predict what an individual would do would lead mostly to incorrect predictions (predictions in the wrong direction).
Best,
Bill P.
Make your life easier with all your friends, email, and favorite sites in one place. Try it now.
[From Bill Powers (2008.12.15.1229 MST)]
Kenny Kitzke (2008.12.15)
···
–
Thanks for the supporting comments, Kenny. I haven’t forgotten that I owe
you a letter. Haven’t thought of what to say yet.
Best,
Bill P.
