[Martin Taylor 2007.09.22.16.22]
Answering two posts in one:
[From Rick Marken (2007.09.22.0940)]
I read the
paper but I can't seem to get my mind around what was done, what the
data mean or why you conclude what you conclude. Maybe if you could
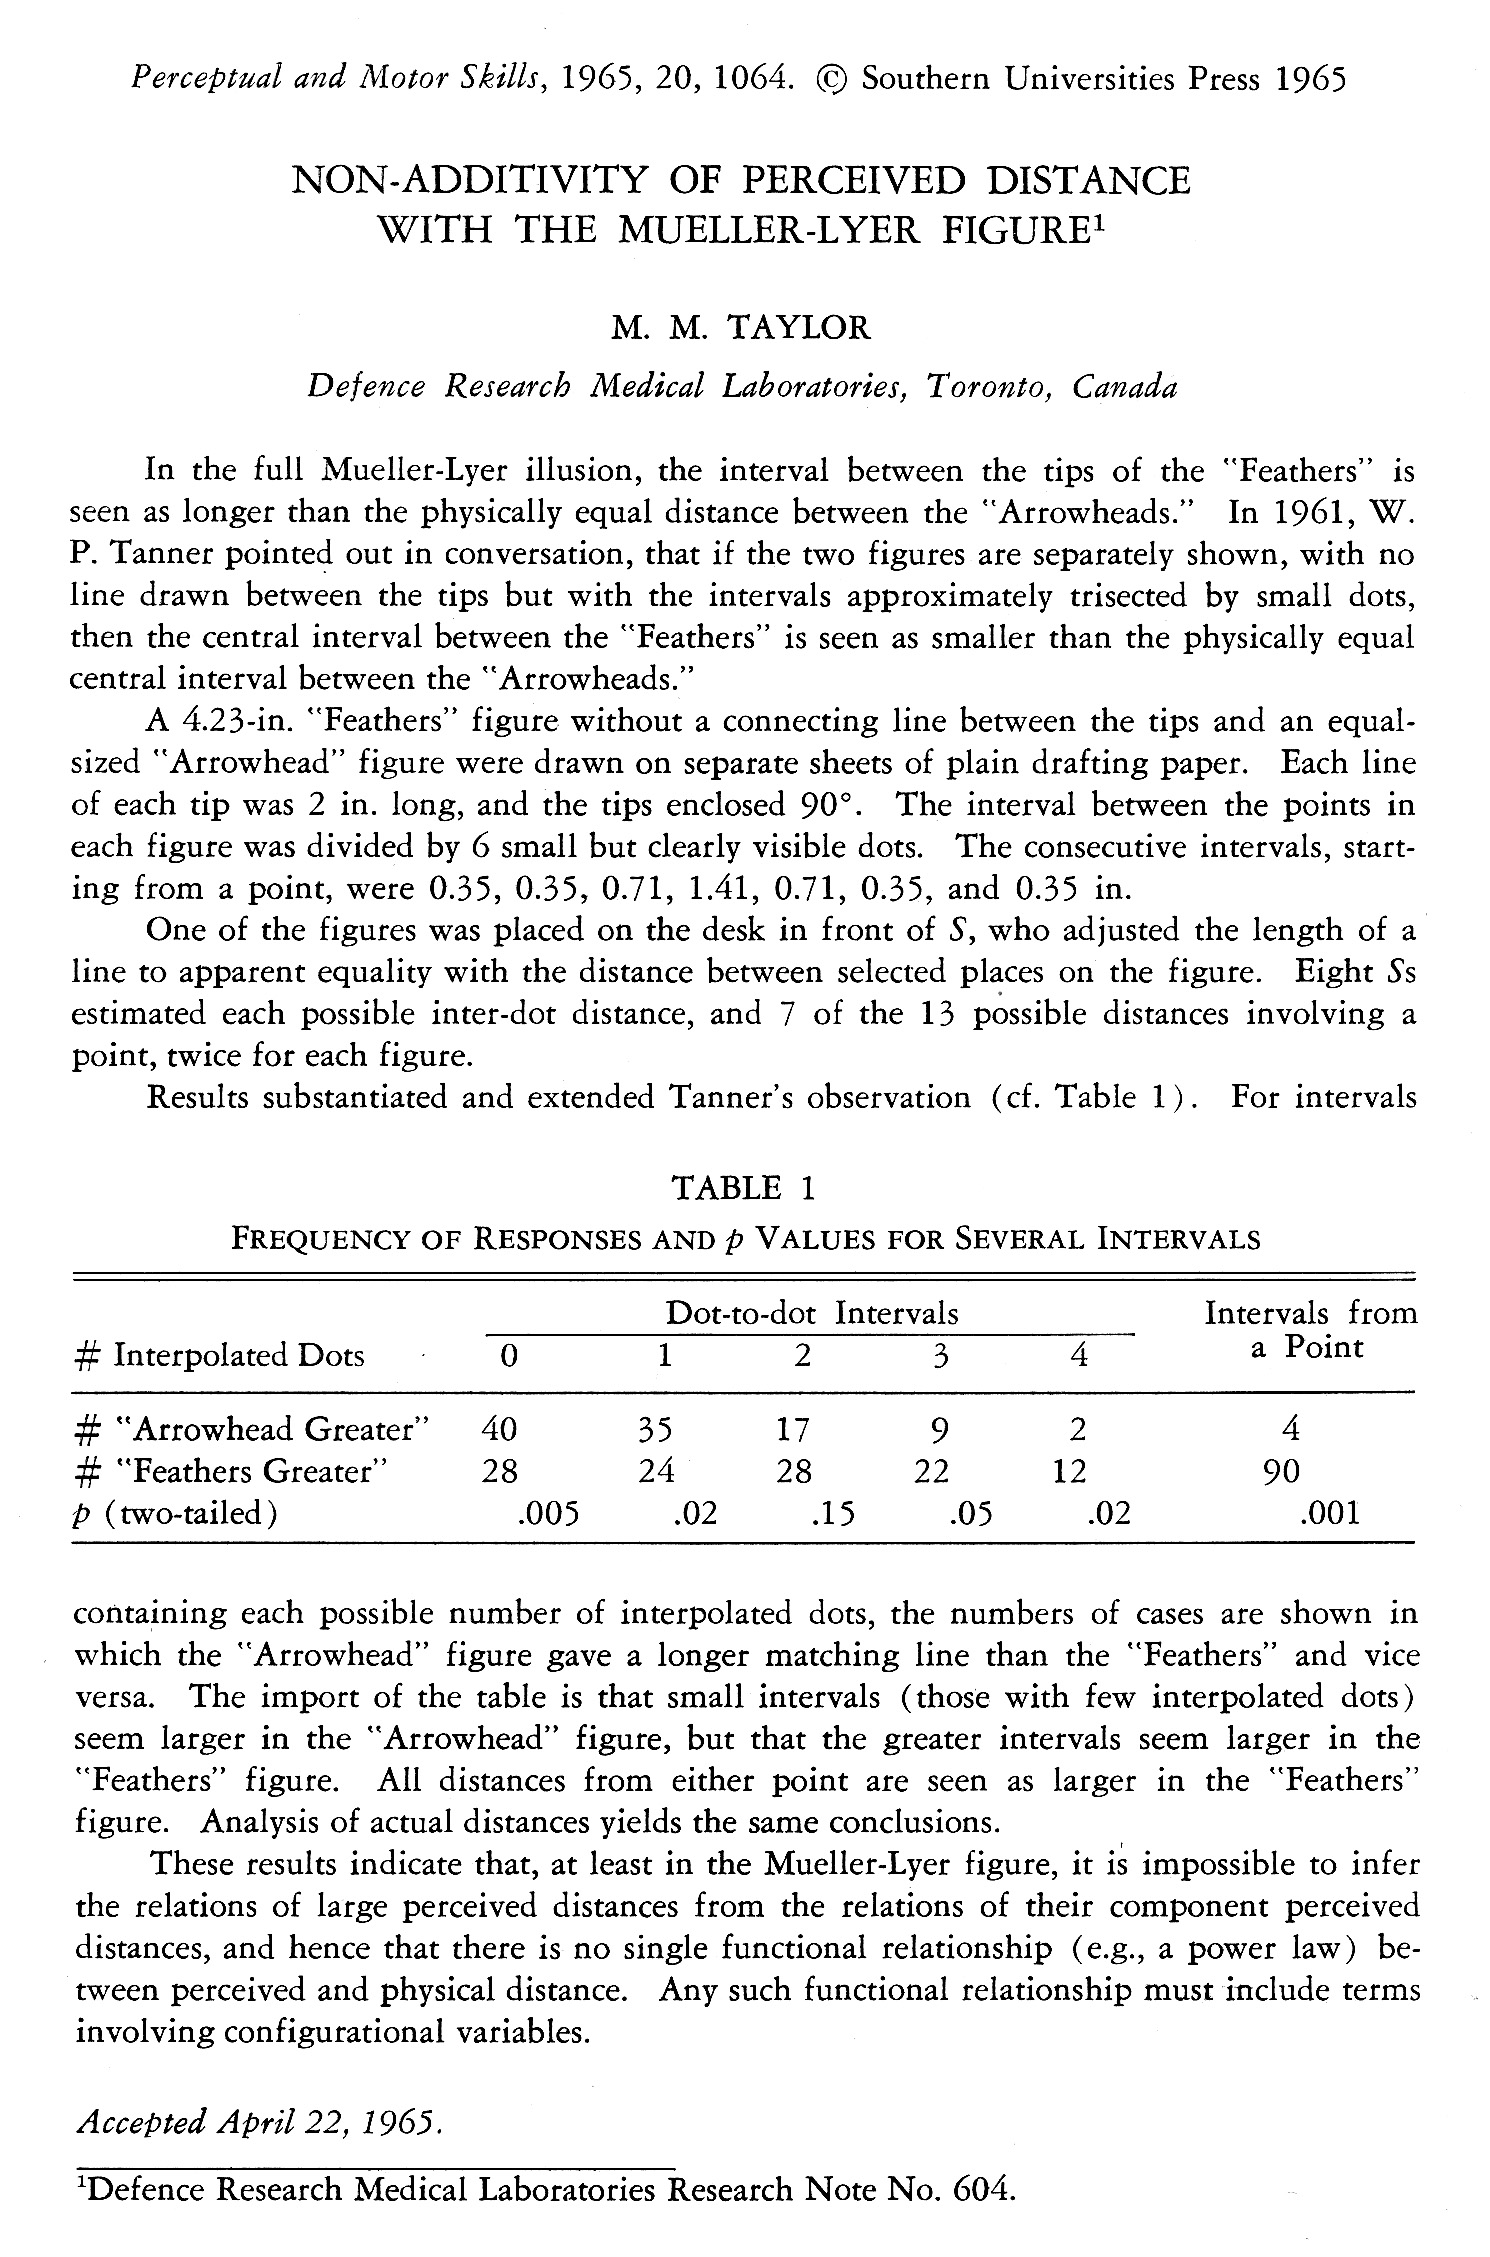
explain what is in the table. You mention seven consecutive distances
in the paper, for example, but then the table has only 5 dot to dot
intervals in the table.
There were six dots between the arrowtips, which makes seven intervals. But there are five intervals between the outermost dots
X . . . . . . X
I considered intervals that included an arrowtip separately from intervals that didn't, so there are only five possible dot-to-dot intervals (if you ignore the fact that the intervals weren't all the same length). The intervals from an arrowtip to a dot or the other arrowtip are called "Intervals from a point" in the table. Anyway the message to take from the table is that the greater the inter-dot interval, the more likely it is that the match to the "Feather" interval will be greater than the match to the corresponding "Arrowhead" interval.
[From Bill Powers (2007.09.22.1230MDT)]
Martin Taylor (2007.09.22) --
That isn't true in this situation, so both laws fail, as do all others that suggest that perceptual magnitude is a function of stimulus magnitude.
I suspected the same thing long ago, but this doesn't mean that the actual perceptual magnitude is not any reliable function of stimulus magnitude. It just says that we can't measure the function by any of the means so far tried (including yours of adjusting a line length to match the perceived length of the intervals).
That's a red herring. Nothing in my experiment has any bearing on what form a functional relationship between stimulus and perception might take, nor did I suggest it did. The experiment says there IS no such functional reslationship, at least not one of the form p = f(s). If at any moment a functional relationship between perceived magnitude and stimulus magnitude exists, it depends on the configuration in which the stimulus exists. In other words p = f(s, C) if there's any function at all.
In the HPCT structure, it implies either that there must be some feedback between the configuration level and the intensity level of perception or that there is no functional relation between stimulus magnitude and perceptual magnitude.
What I didn't get from your paper was any indication of how repeatable the measures were. With only two trials per subject, I don't see how you could get p < 0.005 for the first interval, unless you were averaging the interval across different subjects. If you were averaging across subjects, you weren't getting the right measurement for ANY subject,
I disagree. There are situations in which your objection to averaging is absolutely correct, and others in which it's not. What you can always say is that if you don't measure indivdual subjects, there's no way of knowing where in the distribution any one subject's data may lie. That's what makes the combination of subjects in correlation so subversively dangerous. In one-dimensional data, it's always possible that there are different classes of subjects, but what you can say is that if you choose a person at random from the same population, the likelihood is greatest that the person's data will be near the mode of the distribution.
I don't say that everyne will see the inverse Mueller-Lyer illusion the same way -- almost every illusion will show up people who say "I don't see it". What I observe is that most of the responses given by subjects in the experiment suggest that more people see the inverse illusion than don't see it.
As for the p < .005 measure, I should have stated in the paper what it is in reference to, but I think it's from the binomial probability distribution -- how likely is it that you would get so much divergence from 50-50 from tossing a fair coin.
and of course you have no way of knowing how much variability there was in a single subject's estimates.
Actually, since each subject made two estimates for each figure, I would have done at the time. I don't, from the published paper. It's possible the "p-value" is based on the inter-estimate variation within subjects, but I doubt it.
Maybe the comparison you were looking for is difficult to make accurately.
All I looked for what whether measure A was greater or less than measure B. That's not hard to make accurately.
I don't suppose that you allowed the subjects to adjust the line used for measurement by holding it up to the figure with the dots on it. Doing it that way would have resulted in no errors at all to speak of. So how did they make the comparison?
I don't remember the physical setup, but I can imagine how I probably would have done it at the time. It's only guessing, but the sort of thing I would have done would have been to draw a solid line (or maybe a dot) on a card, and have some arrangement that allowed the card to slide out from under some cover, probably also made of card to minimize the edge contrast. If I were to do the experiment now, I would arrange for the M�ller-Lyer figure to appear horizontally on one part of the screen and have the mouse control a vertical line length or inter-dot distance.
The reason I am a little reluctant to accept the results at face value is that in modeling tracking data, I assume a linear proportionality between the actual and perceived positions of a target and ditto for the perceived position of the cursor, and I get fits within 5% rms (sometimes 2%) for the whole minute's run. Perhaps because the reference condition is "zero distance" between target and cursor, the scaling is rendered unimportant, but it seems to me that the loop gain would be varying a lot (if your data are correct), which would lead us to expect a rather poor fit of the model to the data.
Early on in my modelling of the sleep study tracking data, I used an exponential relation between the actual error and the perceived error. I found that it was very hard to optimize this variable because it's effects could be closely mimicked by a change in overall gain. However, I did find that setting a tolerance region in which a small error was taken to be zero error, but outside that range taking the error to be just the difference between the reference and the perception gave better fits than taking a linear relation all the way.
One thing I am sure of -- the slopes are monotonic. If they ever reversed there would be amplitudes where positive feedback existed, and that is not observed.
You wouldn't observe it, would you, if you were doing either a compensatory or a pursuit tracking task. It's possible you might if you were doing a tracking equivalent of a cross-modal magnitude matching study. It would be difficult to detect in the results, though, because although what you would observe in theory would be a rapid transition across the non-monotonic region, the jump that you would observe in practice wouldn't be instantaneous, but would be limited by the response bandwidth, and would be easily lost in the normal tracking noise.
We aren't talking about big deviations from non-monotonicity, but little wiggles on a generally monotonic function. The only reason I suggested the possibility is from little hints in peripheral results over the years in studies that had nothing to do with magnitude estimation itself (inter-aural pitch matching as a function of frequency is one; number factorization and association value is another, neither published because they were preliminaries for other stuff that was interesting at the time). I just think it's a possibilty that should be kept in mind when one is dealing with a condition in which it might matter.
You wouldn't happen to still have the raw data, would you?
I very much doubt it, but it is remotely possible. I think a rerun of the experiment on a computer screen would give much better data. Particularly for the shorter intervals, the published data are likely to be noisy simply because of the need to measure accurately the distance produced by the subjects. That shouldn't be an issue in a computerized experiment.
Martin
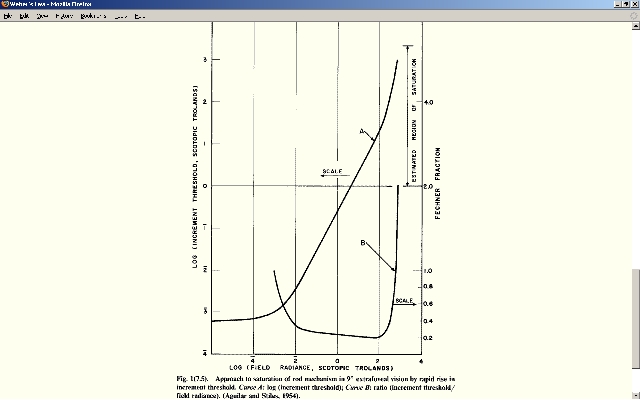
PS. I'm puzzled as to what the plot of the Weber fraction you posted a few minutes later is supposed to imply.