Hi Adam
> The problem, however, is that researchers tend to treat these regularities (which really aren’t all that regular) as indicating something important about how behavior works.
You’re being too vague with “something important”. Tremor does indicate something important being wrong somewhere in the movement control system. Lengths of delays in different control loops do indicate something important about the possible locations of the controlled variables in the hierarchy. One possible mistake is to assume that some property of behavior is the intended property.
The regularities I was talking about were the examples Richard and I gave in our IAPCT talk: LOT, power law of movement, invariant movement trajectories, gait planarity. Common to all of these is that they are regularities noticed without any understanding that behavior is a control process. They are regularities that are detected without knowing what perceptual variables the system is controlling. So it is not known whether those regularities reflect something important about behavior or not. And, indeed, when the behaviors involved are looked at through control theory glasses (as we did in our talk) these regularities can be seen as irrelevant side effects of control. The regularities you mention in your reply – purpose tremor, time to react in different control loops – do, indeed, indicate something important about behavior because they are observations of aspects of control.
So they tend to get kind of defensive when the explanation of these regularities is shown to be that they are a side effect of controlling.
You’re guessing that is the reason why they’re defensive. It just might be they are defensive because you accused them of ignorance in mathematics, and of not knowing how to calculate basic properties of trajectories, etc.
Well, I hate to go all psychoanalytic on you but it seems to me that this is a clear case of projection;-) I think it was “they” who were accusing me of ignorance of mathematics and of not knowing how to calculate basic properties of trajectories. Far be it from me to accuse anyone of these things since I am not much of a mathematician and know little about calculating basic properties of trajectories. All I know is that I proposed a simple, testable control model of movement trajectory production that accounts for the existence of the “power law” and the reaction was that it was not very encouraging, to say the least.
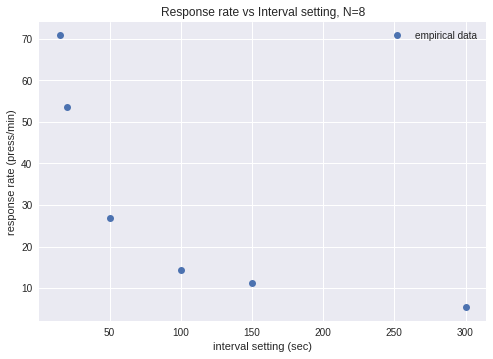
But please, that is for a different thread, this one is about rat experiments. Here too we have an interesting regularity in the pressing rate distributions; or the inverse, 8-press response intervals.
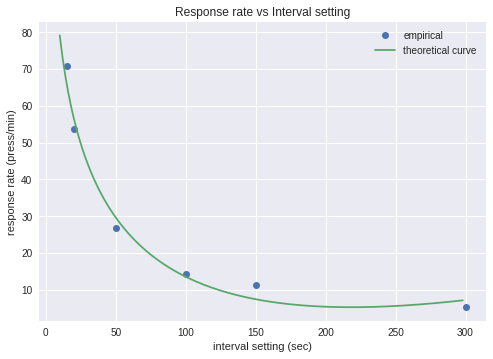
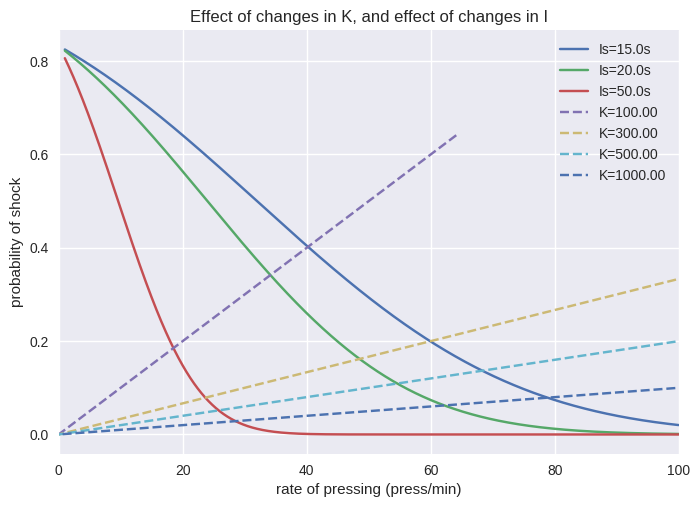
I think Powers’ used the Verhave “rat experiment” to show how to analyze behavior from a control theory perspective. In operant experiments the purposeful nature of behavior is quite obvious; the animal is clearly controlling something about the consequences of its “operants” In this experiment, the rats are clearly controlling something about the shock by pressing the lever.
Bill saw that the operant situation was simple enough – and Verhave provided enough information – so that a control model of the behavior could be built. The exercise was useful because it showed that shock avoidance behavior was a control process and that figuring out what perceptual variable the rat was controlling (in this case rate or probability of shock) was central to understanding the observed behavior. The modeling effort also showed that this kind of experiment tells you very little about the rat in terms of its sensitivity to error (the deviation of shock probability from 0). So it is these facts about studying the behavior of control systems that I believe is what the Powers’ (1971) paper is about, and what I think this thread is about.
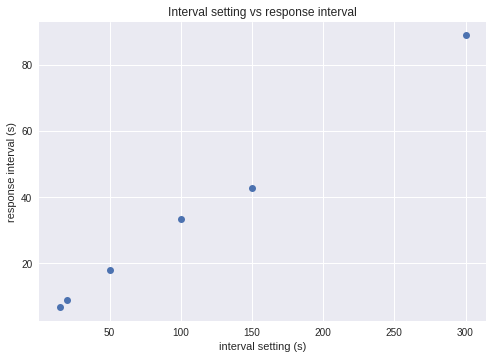
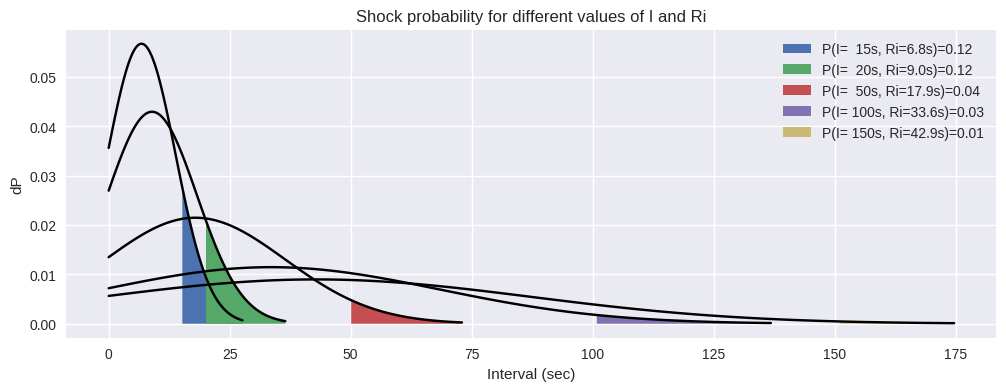
These are the distributions of response intervals for different settings of the shock timer (except for the last one, for visibility)…
These probabilities are not equal, the rat received much more shocks for the 15s interval setting than in the 150s interval setting…
My guess for the differences in the distributions is that the rat just couldn’t press fast enough all the time. He got tired, nervous, etc. The distributions are the result of these random properties, and they might be modeled by a random disturbance. Also, not to forget, these are hypothetical distributions made to fit the data, not empirical ones.
I think what is needed is more data, specifically detailed data on the actual distribution of inter-response intervals (and shock probabilities) in a fixed interval shock avoidance experiment. Then you wouldn’t need to estimate theoretical response interval distributions. Otherwise, I think more modeling given the small amount of data available in the Verhave experiment isn’t going to improve the fit of the model by much.
I think we’ve learned what we can learn from Bill’s (and your) analysis of the “rat experiment”; and what we have learned is something about what to consider when designing experiments aimed at studying the controlling done by living systems. I suggest that the next step might be to design an experiment to determine what variable(s) a person is controlling in a situation might be is of interest to you, such as the variables controlled when a person moves a cursor around a computer screen in various trajectories.
Best
Rick