[From Rick Marken (2016.08.04.1540)]
Martin Taylor (2016.07.21.23.23)–
MT: This discussion is a waste of time, and moreover likely to prove a strong deterrent for any serious scientist who might think that CSGnet could be a serious place to discuss real PCT problems.
RM: I believe this discussion has been anything but a waste of time. It is indeed likely to prove a deterrent to scientists (if any are listening) who don’t understand the nature of control in living systems – scientists who refuse to look at behavior through control theory glasses. But it may attract those who have the courage to peek through control theory glasses and see that for over 100 years behavioral scientists have been studying mostly irrelevant side effects of control. It takes courage to look through control theory glasses because doing so reveals the “nightmare” that Powers was referring to in his 1978 Psychological Review paper when he said: “The nightmare of
any experimenter is to realize too late that his results were forced by his
experimental design and do not actually pertain to behavior. This nightmare has
a good chance of becoming a reality for a number of behavioral
scientists”. Looking at the research on the power law through control theory glasses reveals this nightmare with mathematical precision.
MT: The problem Alex initially posed is an interesting one. It would be nice if someone would try to address it.
RM: I did address it but you, Bruce, Warren and Alex certainly didn’t appreciate the way I addressed it. So, for the benefit of a couple of people who asked me in private emails to review my analysis – and also to let me see if I am the only one who thinks that I have correctly addressed, from a PCT perspective, the problem Alex posed-- I will give a synopsis of how I addressed the problem Alex posed.
RM: Here is the problem Alex initially posed (to CSGNet on July 6):
Alex: Any ideas why or how “the control of perception” may give rise to this power law constraining geometry and kinematics in humans, and now in fruit fly larvae?
http://biorxiv.org/content/early/2016/07/05/062166
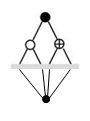
RM: The pointer is to a recent paper by Alex and two other authors which describes the finding of “The velocity-curvature power law in Drosophila larval locomotion”. The first figure in that paper nicely illustrates what was found:
RM: The finding is that the relationship between angular velocity, A(t), and curvature, C(t), at each instant (t) during movements made over time (the blue squiggle) is the same power function (the equation in the upper right) for humans tracing a line (the hand with pencil) and Drosophila larvae following a path (the worm). The “same power function” means that a power function equation (in the upper right of the figure) fits the human and larval movement data nearly perfectly. The fit of a power function to the data is determined using linear regression with the log of the C(t) values as the predictor variable and the log of the A(t) values as the criterion. The resulting R^2 values are quite high, typically greater than .92 (the C(t) values account for about 92% of the variance in the A(t) values).The coefficient, b, that gives the best fit is around .67 for humans and .75 for the larvae. While the coefficient for the larvae is higher than that for the human, it is about the same as the coefficient found for humans making hand movements in water rather than in air.
RM: Research on the power law goes back at least to 1983 and a paper by Lacquaniti, Terzuolo & Viviani (Acta psychologica, 54, 115-130). Because they were finding that the b coefficient of the power law relating C(t) to A(t) for human movement was always close to .67, they proposed the “two-thirds power law” which say the “true” power function relating curvature to angular velocity in human movement is:
A(t) = kC(t)2/3
RM: The power law is sometimes expressed as a relationship between tangential (rather than angular) velocity, V(t),and radius of curvature (Rather than curvature), R(t),in which case the power law follows the one-third power law:
V(t) = kR(t)1/3
RM: The change in exponent results from the fact that V(t) and R(t) are proportional to A(t) and C(t) as follows:
V(t) = A(t)/R(t) and R(t) = 1/C(t)
RM: So what is the PCT explanation of this finding of a consistent 2/3 power law relationship between curvature, C(t), and angular velocity, A(t) or the equivalent consistent 1/3 power law relationship between radius of curvature, R(t), and tangential velocity, V(t)?The researchers in this area believe that the power law reflects a biological constraint on how curved movements are produced. That is, curvature, C(t) or R(t), is seen as an independent variable that constrains how quickly the movement around the curve, A(t) or V(t), can be produced. And the models that have been developed to produce movements that follow the power law have been caused-output models that are developed to cause outputs – instantaneous movement velocity, A(t) or V(t) – that obey the constraint that is imposed by the curvature through which the movement is taking place.
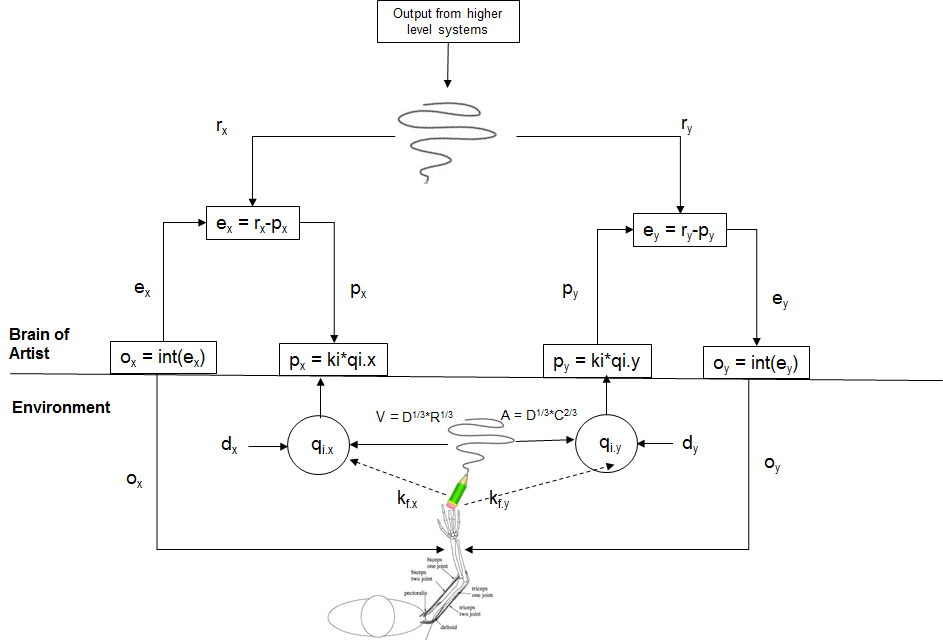
RM: The first step in my PCT analysis of the power law was to develop a PCT model of a person intentionally making squiggly drawing movements in X,Y space, like those in the figure above. The PCT model is shown below:
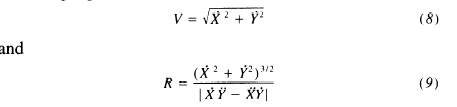
RM: I didn’t expect the movement pattern produced by this model to fit a power law because I was assuming that the power law had something to do with either the nature of the feedback connection of output to controlled input (k.f in the diagram) or the nature the output function itself (o.x and o.y). But in order to test this I had to obtain measures of A(t) and C(t) or V(t) and R(t) to see how well a power function fits the relationship between thee variables. I was able to find computational formulas for V(t) and R(t) in a paper by Gribble & Ostry (1996, Journal of Neurophysiology, 76, 2853-2860). The computational formulas are below:
RM: Since these are formulas for the instantaneous values of the variables the implication is that what is being computed is V(t) and R(t). Alex then gave me the formulas for deriving A(t) and C(t) from these measures of V(t) and R(t):
A(t) =V(t)/R(t) and C(t)=1/R(t)
RM: I then ran a log-log regression on the movement pattern generated by the model and was surprised to find that the power law fit all of them pretty well and the best fit b coefficient was always close to 1/3 for the regression of log R(t) on log V(t) and 2/3 for the regression of log C(t) on log A(t). This made me think that the observed power law may just be a property of curved movement itself and may have nothing to do with how the movement is generated. So I generated a few different curved movements from equations (rather than from models of behavior) and found that the power law held for these as well.
RM: The idea that the power law might just be a property of curved movement led me to wonder whether there was a mathematical power relationship between the variables used in studies of the power law: between R(t) and V(t) and between A(t) and C(t). After all, both variables are measures of the same movement pattern at the same instant. So I looked at the formulas for V and R (above) and noticed that V2 occurs in the numerator of R. That is:
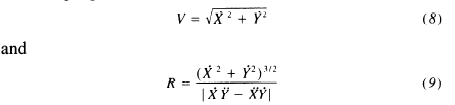
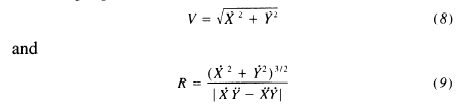
V = (X2 + Y2 )1/2
R = [(X2 + Y2 )3/2]/|X.dotY.2dot-X.2dotY.dot|
Since V2 = (X2 + Y2 )
R
= (V2)3//2 |/ |X.dotY.2dot-X.2dotY.dot|
R = V3 |/ |X.dotY.2dot-X.2dotY.dot|
V = D1/3 *R1/3 (1)
where D =
X.dotY.2dot-X.2dotY.dot|
RM: So the variable V is mathematically in a 1/3 power relationship to R, the very power relationship found in power law studies that is presumed to tell something about how the instantaneous tangential movement (V) around a curve (R) is generated.
RM: Substituting the appropriate formulas for A and C into equation (1) we get the following power relationship between A and C:
A = D1/3 *C2/3 (2)
RM: So the variable A is mathematically in a 2/3 power relationship to C, again the very power relationship found in power law studies that is presumed to tell something about how the instantaneous angular movement (A) around a curve (C) is generated.
RM: The variable D in equations (1) and (2) accounts for the fact that the b coefficient found in power law studies varies around 1/3 (for V as a function of R) or 2/3 (for A as a function of C) for the different movement patterns. Since these studies use only log R or log C as predictors the b coefficient found by the regression will differ from 1/3 or 2/3 depending on the nature of the variance in D that exists in the pattern of movement. When log D is included in the regression, the b coefficient for R or C is always exactly 1/3 (.33) or 2/3 (.67), respectively. (The spreadsheet demonstrating this fact is attached).
RM: So my analysis of the power law, based on PCT, is that the power law is simply a property of curved movement and reveals nothing about how they are produced. It doesn’t matter whether the movement pattern is produced intentionally (is a controlled variable, as it is in my PCT model above and when people intentionally draw squiggles) or a side effect of controlling for something else (as in the case fly larva movement paths). It is based on PCT because I was led to this realization by producing a PCT model of curved movement production. That model showed that any curved movement produced by the model will follow a power law – regardless of how it was produced (in terms of the parameters of the output function).
RM: The implication of equations (1) and (2) is clear; the power law research, which has been going on for over 40 years, is the nightmare Powers warned of: the results were forced by the research design (measuring two related aspects of the same movement pattern) and do not actually pertain to behavior (how the movement pattern was produced). The nightmare exists because researchers took one variable (curvature) to be an environmental variable that is a cause of the other, a behavioral variable (velocity of movement). So the nightmare exists because of a failure to understand that behavior is a control (not a causal) process. Intentionally produced curved movement is a controlled variable.
RM: At any instant the state of a controlled variable, q.i, is a combined result of the effect of system output and environmental disturbances: q.i = q.o+d. So there is no way to learn about the nature of the output, q.o, that produced the observed controlled variable, q.i, by just looking at measures of the controlled variable itself. And all the variables used in determining the power law – A, C, V and R-- are measures of the controlled variable – the pattern of movement – itself.
RM: I knew this PCT analysis of the power law would not go down well with Alex, who has apparently been involved in power law research for some time. But I was rather surprised to find that it went down just as badly with people who are ostensibly fans of PCT. There were several lines of attack directed at my analysis. One was based on mathematics, saying that my derivation was wrong for dimensional or parametric or whatever reasons. Another was based on what might be called domain conflation, saying that though equations 1 and 2 were mathematically correct, they were incompatible with physics and/or biology. And, finally, it was implied that my analysis was incorrect because the spreadsheet I used to demonstrate the analysis had errors in it.
RM: Indeed, the spreadsheet had an error (failure to divide a derivative by dt) but this error had no effect on the computations of the power law demonstrated by the spreadsheet. I have attached the corrected spreadsheet for those of you who are interested in seeing that, indeed, all curved movements – regardless of how produced – result in a power law relationship between curvature and velocity, with the power coefficient being close to .33 for the relationship between log R and log V and close to .67 for the relationship between log C and log A. When log D is included in the regression the power coefficient is always exactly .33 for log R and .67 for log (C) and the R^2 value of the regression is always 1.0 (as it should be if equations 1 and 2 are correct). You can demonstrate this to yourself by pressing the “Random Pattern” button, which generates a new random movement pattern each time it is pressed and see what happens to the value of b when only log R or log C is included in the regression and what happens when log D is also included.
RM: Again, I am really sorry if this analysis shows that a whole line of research is based on results that were forced by the research design. But this analysis at least shows why PCT has such a problem getting accepted by conventional psychologists. The problem is that PCT doesn’t explain the phenomena of interest to conventional psychologists – phenomenon like the power law. It explains the phenomenon of control. Those who know PCT only as a theory assume that it’s a theory that explains the results of all research findings. And it does, I suppose. But more often than not what it explains is that the results of conventional research are not what they seem; they are side effects of control that tell you very little about the behavior under study.
RM: I believe the lesson of this PCT analysis of the power law is very important. The lesson is that before conventional psychologists (and neurophysiologists and many fans of PCT) can correctly apply PCT they have to learn to look at behavior through control theory glasses. Phenomena phirst!
Best regards
Rick
PowerLawRegression071.30.xlsm (638 KB)
···
–
Richard S. Marken
“The childhood of the human race is far from over. We
have a long way to go before most people will understand that what they do for
others is just as important to their well-being as what they do for
themselves.” – William T. Powers