The Dead Zone in Conflicts

Continuing the discussion from Collective control as a real-world phenomenon:

I’m starting a new topic on the phenomenon of conflict. Conflict is relevant to PCT (and vice versa) because it is an intrinsically control phenomenon. If we were not control systems we would never get into conflicts. Paradoxically, conflict occurs because we must control in order to survice and, at the same time, our controlling is what can deprive us of our ability to control. This paradoxical fact about control is the leitmotif of Tim Cary’s and my book Controlling People.

Conflict occurs when two control systems, in the same person or in two or more different people, want the same (or a very similar) perceptual variable to be in different reference states – a physical impossibility. When the conflicted control systems are in the same individual it is called an intrapersonal conflict; when they are in different individuals it is called an interpersonal conflict. The same theoretical principles apply to both types of conflict. Therefore, gaining an understanding of the nature of conflict should be of interest to both therapists, who deal mainly with intrapersonal conflict, and other social scientists (economists, political scientists, etc), who deal mainly with interpersonal conflict.

PCT provides the theoretical explanation of conflict and it makes some interesting (and somewhat surprising) predictions about what happens when there is conflict between control systems. The prediction that is currently of most interest to me is the phenomenon of a Dead Zone. The Dead Zone is the range of values between the references of the conflicted systems for the state of a controlled variable. Disturbances to the controlled variable that occur within this range are completely effective; there is no control in the Dead Zone.

The Dead Zone is demonstrated in a spreadsheet model that I’ve developed that can be found here. This is an improved version of my original model because it can take into account the fact that the contestants in a conflict can get fatigued. Fatigue is an important consideration in conflict because the Dead Zone exists when the conflicted control systems are producing maximum output. And we know that real organisms cannot continuously exert maximum output because their ability to produce output fatigues.

In my earlier models, when the conflicted systems go to maxumum output they simply stay at that level of output until the end of a simulation run. In that case, the Dead Zone is easy to see; dusturbances in this zone are completely effective and measures of control of the variable in conflict show that there is no control at all. But the Dead Zone should be less obvious if output fatigue were taken into account, and this new version of the spreadsheet model shows that this is the case.

Here’s a screenshot of the new spreadsheet:

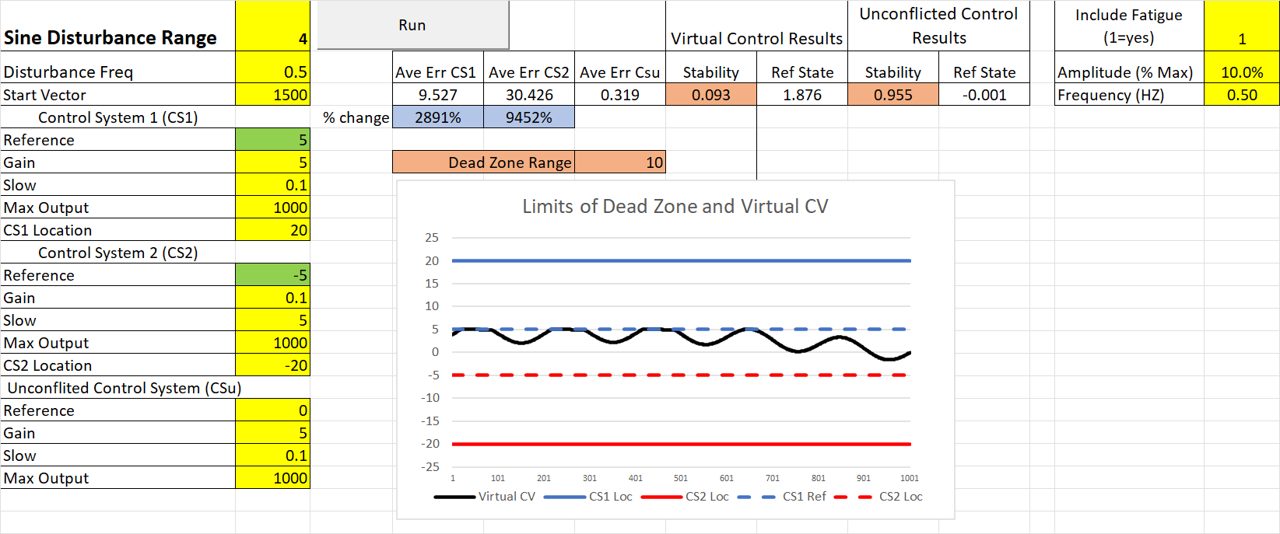
The main addition is the cell in the upper right labeled “Include Fatigue”. You can toggle in the Fatigue factor by entering 1 in the yellow cell to the right and you can toggle it out by setting that cell to 0.

When you open the spreadsheet the Fatigue Factor is toggled in. The Fatigue Factor is modeled as narrow band filtered noise that is always negative so that adding it to the nominal maximum output always lowers that maximum. The amplitude of this noise can be set as a percentage of the maximum output value of each system. On opening the spreadsheet this amplitude is set to 10%. The center frequency of the noise can also be set; on opening it is set to .5 H; fatigue is assumed here to vary relatively slowly in this 20 second run.

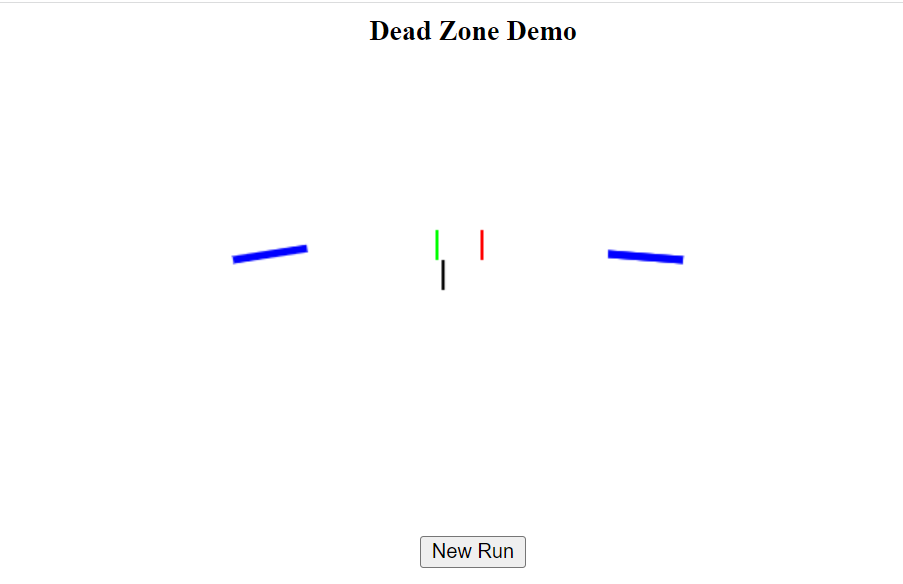
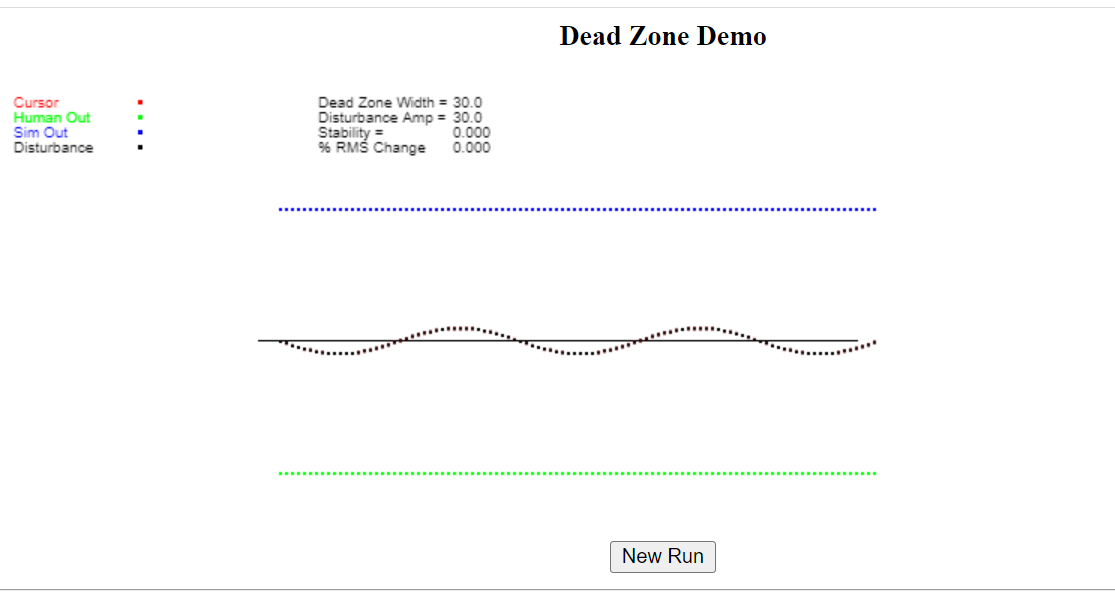
The two systems in conflict – CS1 (location shown by solid blue line) and CS2 (location shown by solid red line) – are trying to bring a variable (shown as a solid black line) to different reference states: CS1 is trying to get the variable 5 units into its territory (dashed blue line in the figure) and CS2 is trying to get the flag 5 units into its territory (dashed red line).

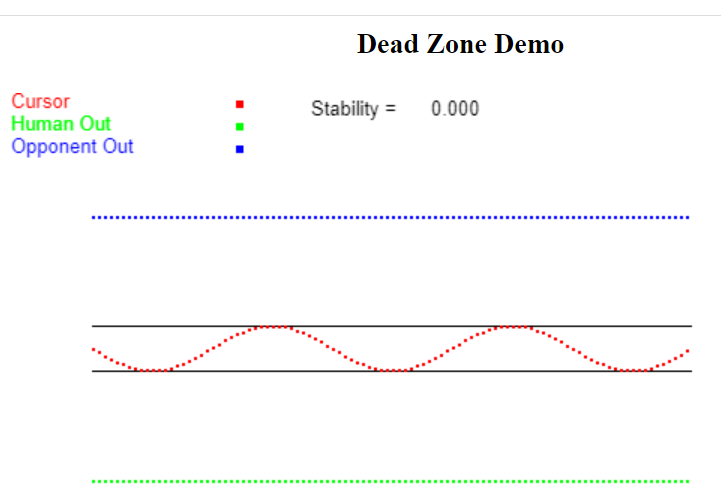
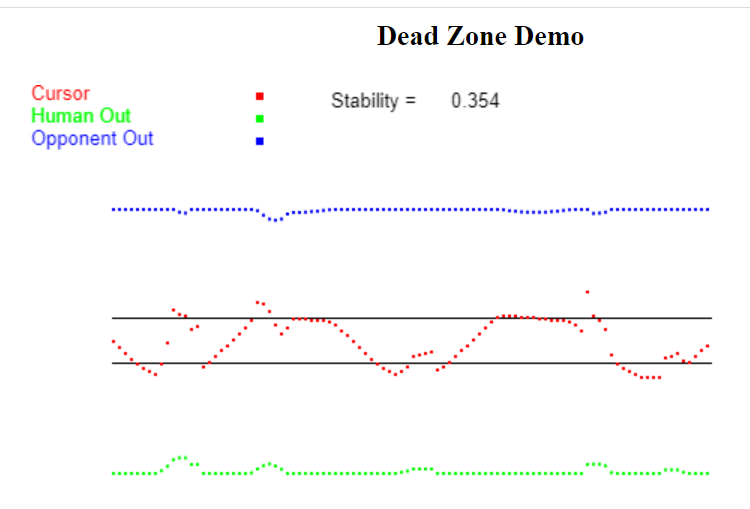
The size of the Dead Zone in this simulation is 10 units, which is the difference between CS1’s and CS2’s references states (dashed lines) for the controlled variable. The amplitude of the disturbance to the controlled variable is 4, which is well within the Dead Zone, therefore the Stability measure of control should be 0.0. And it would be 0.0 if it were not for the variations in Fatigue. These variations bring the Stability measure of control up to .093. This is not very good control (1.0 is perfect control) but it’s not 0.0, which it would be if there were no fatigue – a fact that you can check out for yourself by toggling the “Include Fatigue” cell to 0 and clicking “Run”.

You can experiment around with this model and see how assumptions about the amplitude and frequency of variations in Fatigue affect the measure of control (Stability Factor) when disturbances fall within the Dead Zone.

The simulation is, of course, only theoretical. The next step is to see whether what happens in the simulation happens in reality. I have some ideas about how to test this but I’ll wait to describe them in a later post. For now, I’d be interested in your thoughts about the Dead Zone and its implications for resolving intra- and/or intrapersonal conflicts.

1 Like

I’ve developed an on-line interactive demo to show that the behavior demonstrated in my spreadsheet model of the Dead Zone occurs when a real person is involved in a conflict. The demo is a tracking task where you and the computer try to keep a cursor in two different target positions, which are the two different reference states for the “collectively controlled” variable – the position of the cursor.

When you load the demo into your browser be sure that you browser display is expanded to the width of you screen. You start each trial of the demo by pressing the “New Run” Button. The press will result in a sequence of two prompts. The first prompt asks you for the size of the Dead Zone. This is the distance, in pixals, between the two targets, where the targets represent your and the computer’s references for the position of the controlled variable (the cursor). I recommend starting with a value of 30 for the Dead Zone, which makes for a nice, clear difference between your and the computer’s references.

The next prompt asks you for the amplitude of the distutrbance to the cursor. If the number you enter is less than or equal to the number you entered for the size of the Dead Zone, then that disturbance should not be resisted when you and the computer are producing maximum output. This would be a demonstration of the reality of the Dead Zone. So I recommend that you start by testing this possibility by entering a value for the disturbance amplitude that is exactly equal to the size of the Dead Zone; so enter a value of 30 when prompted for the Disturbance Amplitude.

The tracking task begins as soon as you have entered the Disturbance Aamplitude. Here is a screen shout of what you’ll see:

The green and red vertical lines are the targets; the distance between them defines the width (in pixels) of the Dead Zone. The single black vertical line below the targets is the cursor. The computer has the goal of keeping the cursor aligned with the green target. Your goal is to keep the cursor aligned with the red target. The cursor is moved by the blue “joysticks” to the right and left of the cursor; the computer uses the joystick on the left while you use the one on the right. You move your joystick using the mouse; move the mouse right to rotate the joystick clockwise and left to move it counter-clockwise.

The tracking task lasts about 20 seconds. During that time your task is to produce outputs (joystick movements) that keep the cursor under the red target line. Because you are doing this in conflict with the computer control system, you will fairly quickly reach a limit in the amount of output you can produce to oppose the computer’s output. Maximum output is being produced when the joystick is moved all the to a horizontal position. The same aplies to the computer control system output. When you reach this limit it will feel like you have lost control of the joystick, but you haven’t. You can move the joystick counter-clockwise from this limit but this will just push the cursor toward the computer’s target.

For demonstration purposes I recommend staying at the output limit once you get there. The computer will be producing maximum output at this point as well. So what you will see is the cursor moving back and forth within the Dead Zone (between the red and green targets). This movement is caused by the disturbance that can no longer be resisted by you or the computer control system.

At the end of the 20 second test run you will see a display of the results that looks like this:

The flat green and blue lines are the outputs of the human and the computer control system, respectively. In this display they are flat because both systems are producing maximum output throughout the last half of the run. The sine wave is actually two overlapping sine waves, red for the cursor and black for the disturbance. They overlap because there was no control of the cursor in the Dead Zone; movements of the cursor were completely determined by the disturbance.

At the top of the display is a summary of the results of the trial. First is shown the Dead Zone Width (DZW) and Disturbance Amplitude (DA) used in the trial, followed by two measures of quality of control of the cursor. When DA <= DZW there should be no control of the cursor. Control is measured by Stability and % RMS change.

Stability is measured as 1 - sqrt( var.obs/var.exp) where var.obs is the observed variance of the cursor and var.exp is the sum of the variances of the computer output, human control system output and the disturbance. This measure of control will be close to 0.0 when there is no control of the cursor, as is the case in the example display.

This Stability measure is problematic because it can produce misleading results. If the human control system decides to push the cursor around while it is in the Dead Zone - which can be done if output is not maintained at maximum value – you can get Stability measures that are much greater than 0, making it appear that there is control in the Dead Zone when this is not actually the case.

% RMS Change is a much better measure of control. It measures the amount by which cursor variance (the variance of the collectively controlled variable) is decreased or increased by the actions of the control systems in conflict. If the cursor is being controlled then % RMS Change will be negative; cursor variance is being decreased relative to what it would be if there were no control. Perfect control would a % RMS Change value of -100. There is no control if the % RMS Change is greater than or equal to 0; % RMS Change will be greater than 0 if one or both of the control systems fails to maintain their output at maximum.

Once you’ve gotten the hang of using this demo, you can start doing trials using different values for the Dead Zone width and Disturbance Amplitude. Keep track of the results of each trial (in terms of Stability and % RMS Change) to see how the size of the Dead Zone relative to the amplitude of the disturbance affects the results.

I hope some of you will give this Demo a try and let me know how it goes. Then we can discuss the implications of these results for understanding conflict.

Nice work Rick!

Quick comments:

  • I have not a normal mouse but a touch pad of the laptop. The problem was to keep my cursor (the little arrow, not the cursor of the demo) in the same horizontal line. If it wandered too much down or up then its movements did not affect my joystick any more.
  • The results display could be more informative if it would show the reference lines (and thus the dead zone) instead of the current black zero line.
  • Could you add a second button to the results display: “New run with previous settings”?

Thanks Eetu!

I think I can fix that. Thanks for letting me know.

But there are still problems with the output components of the demo. What would be best would be to have a spring centered joystick as the output device so that you would have to exert a sustained force in order to keep the output at maximum. In the demo,you can keep the output at maximum (once you have gotten there) by just letting go of the mouse or lifting your finger from the touch pad. Since you are no longer having to exert force to maintain max output it feels like you are no longer in a conflict. If someone were to carry on with this research in the future I think it should definitely be done with a spring centered joystick.

Great point. I will do that!

And another great point! I will try to do that as well, though, given my rudimentary programming skills, it might take me a while to get that done.

Based on Eetu’s suggestions, I have made some small changes to my Dead Zone demo. Actually, the only change I was able to make successfully was to add lines to the data display that show the references of the two systems involved in the conflict and, thus, the Dead Zone of the conflict.

I couldn’t figure out how to make the output work better on a touchpad. And I haven’t yet tried to make what I think could be a fairly major change in the applet so that the program could be repeated without re-entering the Dead Width and Disturbance Amplitude to start each run.

But I did tune up the program a bit so that you can now specify the width of the Dead Zone by entering a positive or negative value. If you enter a positive value, the your target (reference) value (the red target bar) is on your side of the conflict and the computer’s target (the green bar) is on its side of the conflict. This looks like an approach-approach conflict since both parties are trying to get the cursor to move the cursor toward (approach) themselves. If you enter a negative value, then the computer’s target is on your side of the conflict and your target is on is on the computer’s side of the conflict. This looks like an avoidance - avoidance conflict since both parties want the get the cursor away from (avoid) themselves. (You would see what looks like an approach-avoidance conflict if one of the targets was not visible. The the system controlling for keeping the cursor under the visible target would seem to be trying to approach it and the system controlling for keeping the cursor under the invisible target would seem to be trying to avoid the visible one.)

It seems to me that the Dead Zone should be of particular interest to those using PCT in therapy since it has interesting implications for how people will deal with intrapersonal conflict. Specifically, if the conflict producing references (analogous to the target positions in the demo) are close together – the Dead Zone is very small – then it would look like there is no conflict at all; the person in conflict will be able to deal with most disturbances to the variable in conflict (analogous to the position of the cursor in the demo) since these disturbances are likely to fall outside the Dead Zone and be resisted.

If, on the other had, the conflict producing references are far apart – the Dead Zone is very large-- then the conflict will be quite evident since the person in conflict will be unable to deal with any disturbances than the most extreme ones; the person’s behavior (in terms of the behavior of the variable in conflict) will appear to be completely driven by external circumstances (disturbances).

The Dead Zone only exists in a conflict when both (or all) control systems involved in the conflict are producing maximum output, This may be more likely to occur in inter- rather than intrapersonal conflict. But the Dead Zone can occur in intrapersonal conflict and, when it does, the size of the difference between the conflict producing references will affect the way the conflict “presents”. I think this should make the Dead Zone a phenomenon of considerable interest to clinicians.

Why no interest?

Well, now I know that the best way to shut down conversation on IAPCT Discouse; just present some actual data :wink:

But I’ve got a couple moments now so I’ll try to quickly explain what I think are the clinical implications of the Dead Zone.

First a reminder: The Dead Zone is determined by the distance between the references for the value a commonly controlled variable (CCV). Disturbances that don’t move the CCV outside the range of the Dead Zone will not be resisted. So the appearance is that the systems in conflict have lost control of the CCV. When the systems are in a single indiividual this is seen as neurosis.

If, however, disturbances to the CCV cause it to go outside the range of the Dead Zon will be resisted, the amount of resistance depending on how far out of the Dead Zone the CCV is moved. So when the amplitude of the disturbance is large enough, even when systems are in conflict will appear to be in control. When the systems are in a single indiividual this is seen as a person who is apprently “in control” when they are actually experiencing considerable pain (error).

The clinical implication of all this, it seems to me, is that there can be different degrees of conflict depending on the size of the Dead Zone; the larger the Dead Zone, the worse the conflict. With a large Dead Zone, most disturbances to the CCV will go unresisted. So the person in such a conflict feels “out of control”, is experiencing considerable error and will present as having a problem.

With a small Dead Zone, the same level of disturbance to the CCV will be actively resisted. So the person in this kind of conflict might not feel like things are particularly out of control but will be experiencing considerable error. Such a person might not even show up for help but if they do it would probably just present as a person who feel like things are just not feeling right.

Of course, there are other complexities involved. Conflicts are not always a problem, especially if one of the systems involved in the conflict has much lower gain (strength) than the other(s). Indeed, when I first got on CSGNet I discovered that when one of he systems involved in a conflict is very low gain, the performance of the opposing system can actually be improved relative to what it would be without the conflict! Bill Powers dubbed this discovery the “Marken Effect”. I apparently mentioned this last year in a discussion of “collective control”.

The Marken Effect was discovered in the context of interpersonal conflict but I see no reason to doubt that it could also occur in the contect of intrapersonal conflict. And now it will be possible to see how this effect might be influenced by the size of the Dead Zone in a conflict.

So it looks like the study of conflict might be a fruitful area for clinical psychological research.

1 Like

Thanks Rick! I like how you’re transforming the discussion from whether conflict is a problem or not to a question of the conditions and the circumstances that make it a varying degree of a problem, and sometimes a benefit!
Your work might end up being crucial if we are to try to develop modelling with any real world reality. I’ll be sharing it shortly…

1 Like

Thanks for this. It encourages me to change the topic of my proposal for the 2023 conference. I’ll try to get a revised proposal in today.

When you get a chance could you please send me a list of what you think are the important non-PCT based research studies of conflict.

1 Like

Good news!!

Here are two helpful reviews:

https://www.tandfonline.com/doi/pdf/10.2147/NDT.S91861

1 Like

Hi all,
Thank you @rsmarken for your presentation about this topic at the IAPCT conference.
I kept on thinking about what this dead zone is like, in real examples. I am curious what you think about these examples.

Tug of War
As a participant at an old fashioned village party I got to experience the tug of war game betweem teams of strong men and women. What I noticed that in the games with less precise control (the women were more unequally distributed in strength and weight, and less prepared than the men), the game was over quickly. The knot hovered a bit in the middle, and a strong tug toppled the opponent team and meant victory. The men had prepared for this, were wearing mountain boots, had a special technique to dig themselves in and that game lasted for more than 20 minutes with the not stabilized between the two poles. It was a classic conflict situation and a perfect illustration of the dead zone.

My question then, is what does that dead zone mean?
The men are fixated on controlling the perceptual variable - the knot in the rope - in different reference states for each team. The knot is stuck in the middle while both teams pull to their maximum capacity.
Does the dead zone mean that if someone else joined team A and started pulling, Team B would have no power to resist that extra pull and lose?
Or does the dead zone mean that the men involved in the game are not able to resist other disturbances, for example if someone would try to push them over?

Frozen conflict
Our travels into the eastern part of Europe and beyond sometimes led us into areas which may be considered ‘dead zones’ in a long term conflict. For example, Transnistria, locked between Ukrain and Moldavia; Nagorno Karabakh between Armenia and Azerbaijan; South Ossetia between Georgia and Russia. In these non-existent countries, time seems to stand still. You pay with cash, sometimes in currency that is not recognized anywhere in the world. Everything happens at a small scale, these non-recognized countries operate in isolation.That is part of its allure for travellers, that modernization seems to have passed by. Nothing new is build because it risks a retailiation from the other side of the conflict. And keeping the conflict in that stable position takes a lot of effort from the opposing sides; effort that cannot be used more fruitfully elsewhere.
What @rsmarken told about how the middle position in a conflict can look like a controlled variable, but actually isn’t, becomes evident when the opposing forces change and suddenly the conflict can be won by one of the sides. Such as how Azerbaijan was able to overtake Nagorno Karabakh when the international powers shifted. With dire consequences. Which, thinking of it, makes me realize how conflict is bad, but how forcefully ‘solving’ a conflict may be worse.
What, in this case, is it that halts development in a dead zone?

Eva

How is it determined? A simple linear function? Power law or quasi-logarithmic? Some other function?

  1. That’s one way this can appear to the observer.

  2. The appearance is that there is a reduction in loop gain for each system. Loop gain may be increased or decreased at any point in the loop. In this case, loop gain is decreased in the environmental feedback function. More precisely, within the intersection of their respective environmental feedback functions.

  3. One could as justifiably say that “the appearance is that” the contestants don’t care as much within this region. The appearance is that the input is ‘close enough’ to the reference to satisfy the comparator issuing the error. I would attribute that to imprecision in the higher-level PIF. That’s the function which say what is good enough and what is not. I suppose it could be lower loop gain, but I don’t know how that would come about or where in the loop. This is what Martin called a ‘tolerance zone’ (PPC I.4).

Supposition: A well-prepared tug-of-war team is able more steadfastly to hold the line within the dead zone, and the catastrophic collapse of the less well prepared team follows from a brief lapse by the less well-prepared team that lets the CV slip out of the dead zone.

Testable supposition: Start with a stalemate condition in a tug-of-war.

  • A 3rd party applies a slight disturbance in favor of one side. If the resulting deviation is within the dead zone the stalemate persists.
  • Vary the disturbance. This reliably defines the boundaries of the dead zone (ceteris paribus: actual players tire, etc.).

In a human situation the ‘unfair’ intervention would have to be invisible to the players.

I see no way to distinguish this from lowered loop gain in each of the players independently. Do you? Other than old Ockham saying that equal gain reduction is far less probable than a single effect within the intersection of their respective environmental feedback functions.

1 Like

Before I do that, let me preface with some facts about the Dead Zone that I probably didn’t make clear in my talk. A Dead Zone is known to exist when:

  • There are two parties to a conflict (it may exist in multi-party conflicts but this hasn’t been studied yet).
  • Each party has a different reference for the same controlled variable
  • Each party can produce the same maximum output

My Dead Zone demo is a “real” example of the Dead Zone inasmuch as one party to the conflict is a real person. But I think by “real” you mean a conflict that is not contrived (as in the demo) but occurs naturally. So in that sense your examples of conflict are somewhat more “real” than the one in my demo. So here are my thoughts on your examples:

It means neither of these things. In the case of this Tug of War, the Dead Zone means that disturbances to the commonly controlled variable (CCV) – the position of the knot in the rope – will NOT be resisted if they do not push the CCV outside of this Zone. But it is not possible to demonstrate the existence of the Dead Zone in this Tug of War because you can’t apply disturbances to the CCV – position of the knot.

Recall that a disturbance is that is INDEPENDENT of the effects on a variable that are being produced by the agents trying to control it. If you tried to disturb the position of the knot – the CCV in the Tug of War – by pulling on the rope, your efforts would simply be adding to the effects of one team or another, depending on which way you pull.

You could demonstrate the Dead Zone in this Tug of War by changing the CCV from the position of a knot in the rope to the position of a flag draped over the rope. Once the Tug of War has stabilized (both Teams are producing max output so that the flag remains stationary) you can produce disturbances to the position of the flag – disturbances that are independent of the outputs of both teams – by moving it by varying amounts away from it’s stabilized position (NB: Make sure both Teams know that you are going to be doing this and that it’s OK with them!).

What you should see is that small displacements of the flag around its original position are not resisted; they are within the Dead Zone. But large displacements should result in resistance. If the large displacement is towards Team A then the resistance will come from Team B and vice versa. The resistance will bring the flag back to its original, stabilized position. This should give you a pretty good ballpark estimate of the size of the Dead Zone in this conflict.

In order to understand these conflicts you have to know the CCV and who is trying to control it. My guess is that the main CCV in all these conflicts is the ethnic make up of the non-state regions. For example, Georgia and Russia may be in a conflict over whether South Ossetia should be mostly Russian or mostly Georgian. Since Russia is surely much stronger than Georgia and, thus, able to produce much greater output, it seems unlikely that there is a Dead Zone in this conflict (because the Dead Zone exists only when the parties are producing equal max output). But this could be tested empirically by seeing what kinds of disturbances result in instability. A disturbance might be something like an attack by the ethnic South Ossetians on Russians or Georgians. If there is a Dead Zone then an attack that resulted in a small number of injuries of deaths of Russians or Georgians would meet with little or no resistance.

Yes, that is true of any conflict, whether there is a Dead Zone (because both parties can produce equal maximum output) or not.

Exactly!

Dead Zones are nether good nor bad; they just exist in a particular kind of conflict and their existence let’s us see that the stability of a collectively “controlled” variable is not an example of control. As I noted in my talk, however, knowledge of the possible existence of a Dead Zone in an intrapersonal conflict could make it possible to “measure” the magnitude of the conflict in terms of the size of the difference between the reference specifications for the CCV involved in the conflict.

1 Like

Linear function: Dead Zone = Rh - Rl, where Rh is the higher reference value and Rl the lower one.

Yes, it’s as though the loop gain goes to zero in the Dead Zone. But we know from the modeling that accounts for this Dead Zone phenomenon that there is no change in loop gain; the Dead Zone is caused by the fact that each party to the conflict is trying to keep the same variable at a different reference level and producing equal max outputs to do it.

The problem with the “Tolerance Zone” explanation of the Dead Zone is that we know that the size of the Dead Zone is exactly equal to the difference between the references for the CCV. The systems in conflict are not “tolerating” disturbances; they are simply unable to act against them in the region between their disparate reference specs ( goals). In my Dead Zone demo you can easily vary the size of this “tolerance zone” without varying your tolerance at all. You do it just by varying the distance between the targets for cursor position for yourself and your opponent.

Try to be “well prepared” in my Dead Zone demo and see what happens. Spoiler alert: not what you suppose.

Tested, confirmed and discussed in my 2023 IAPCT Conference talk (see slide 13). But kudos for coming up with exactly the same approach to measuring the size of the Dead Zone as I did.

Yes, there is a way. It’s called modeling, which involves developing a model and testing it against ACTUAL HUMAN PERFORMANCE. When you do that (as I do in my Dead Zone demo) you find that lowered loop gain has nothing to do with the Dead Zone; it’s all about the size of the difference in reference specifications.

Hi Rick can you explain how, in a tug of war game or in your model, a larger disturbance (the knot is pushed a a bit in the direction of Team A, but stays within the dead zone) is resisted? Team A and B are already pulling at maximum capacity (that’s what makes it a dead zone). How can Team B resist a disturbance if it is already pulling at maximum output capacity?

Eva

Hi Eva

A disturbance that pushes the knot (the CCV) in the direction of Team A but stays within the dead zone is NOT resisted. A disturbance is only resisted when it pushes the CCV out of the Dead Zone. So a disturbance WILL BE resisted when it pushes the CCV toward Team A (or B) AND out of the Dead Zone.

This is what is demonstrated in my Dead Zone demo. Here is a plot of the behavior in a conflict when a sinusoidal disturbance pushes the CCV just to the limits of the Dead Zone:


The graph shows that the disturbance is completely effective (no resistance); the CCV (the cursor) moves right along with the disturbance.

Now here’s a conflict with the same size Dead Zone but a higher amplitude disturbance:


When the disturbance drives the the cursor outside the Dead Zone there is resistance, which can be seen in the little bumps in the output traces of Teams A and B (green for me, blue for the computer control system opponent). These outputs are not very strong or consistent but they do resist the disturbance enough to keep it from pushing the CCV too far outside of the Dead Zone.

Best, Rick

Thank you Rick,
The visuals are very clear.
One question: is the effort which the Human and Opponent can put in resisting the disturbance in any way limited? Is there a maximum to their energy or effort?
If so, how can they resist the disturbance if they are already pulling at maximum capacity?
If not, shouldn’t it be constrained somehow if you want the model to be like a living organism?
Eva

Thank you, Eva!

Great questions! The answers are “yes and yes”. The outputs of both Human and Opponent are limited in how much they can move the blue “joysticks” from vertical (0 output) to horizontal (maximum output). And they are limited to being able to produce the SAME maximum output. It is only when the maximum outputs of Human and Opponent are the same that a clear Dead Zone exists. Indeed, if the maximum output that can be produced by one party to the conflict is even slightly greater than what can be produced by the other then that party wins the conflict; he or she can compensate for the varying “passive” environmental disturbance AND the disturbance created by the output of the other party.

They CANNOT resist the disturbance when it is within the range of the Dead Zone. But when the “…disturbance forces the controlled quantity [CCV - RM] close enough to either reference level…there will be a reaction. The control system experiencing the lessened error will relax, unbalancing the net output in the direction of the other reference level. As a result, the conflicted pair will act like a single system having a ‘virtual reference level’ between the two actual ones.” (Powers, B:CP, p. 255).

Try running the Dead Zone Demo with different combinations of values for Size of the Dead Zone (SDZ) and Amplitude of the Disturbance (AD); such as: SDZ = 30, AD=30; SDZ = 30, AD=50; SDZ = 5: AD=5; SDZ = 5 AD = 50. Compare the outputs of the Human (you; green colored trace) and the Opponent (computer model of a Human; blue colored trace) . What you will see is that they behave in the same way. This is especially clear in the cases where AD is > SDZ; both the Human and Opponent behave in the same way, relaxing when the net output goes their way (getting the cursor closer to their target (reference) state. I think this shows that the control model (the Opponent) is an accurate model of both parties to the conflict.

By the way, the fact that the Dead Zone exists only when the parties to the conflict are producing maximum outputs that are EXACTLY equal, suggests to me that we would see a Dead Zone less often in interpersonal conflicts than in intrapersonal ones. Look at the interpersonal conflicts that are making the headlines now. I believe there is a huge asymmetry in the maximum outputs that can be produced by the parties to these conflicts.

I think such asymmetry is much less likely in intrapersonal conflicts since the control systems in conflict are within the SAME person and are, therefore, using the same outputs. And, indeed, Bill’s example of a Dead Zone existing in real behavior is of a person who has “… two goals: one to be a nice guy and the other to be a strong, self-sufficient person. If he perceives these two conditions in the “right” way (for conflict) he may find himself wanting to be deferential and pleasant, and at the same time wanting to speak up for his rights. He drifts in a state between, his attitude fluctuating with every change in external circumstances [disturbance variations–RM], undirected…”.(Powers, B:CP p. 255)

This is why I think the Dead Zone concept is particularly relevant to clinicians. If you could get a quasi-quantitative idea of how extreme a disturbance must be for a person in conflict to react to it (act to bring the CCV back to the virtual reference level) you could get an idea of the magnitude of their conflict.

1 Like