The Meaning and Origin of Goal-Directedness: A Dynamical Systems Perspective

As they say, “that’s not a bug, it’s a feature”. You [RM] are asserting that if something applies everywhere, it therefore does not apply to PCT.

In my view, PCT is a science, not a fantasy in a world walled off from the rest of science. As a science, one of the features of PCT is that even the most complex of PCT hierarchies and social interactions among hierarchies all have their (to quote Eetu from years ago) “ways of being”, and their ways of being described. A two-dimensional phase plot is one way that sometimes is useful, in that it helps some people understand a bit more about what to expect of a simple control loop.

The concept of a “basin of attraction” does not apply usefully if the control loop is linear. It applies to a linear system, but there is only one basin, and that extends to infinity. The concept is more useful for non-linear systems, such as control loops that have a limit to how much force they can apply to the environmental variable that corresponds to the perceptual variable. Such a loop can be driven out of its basin of attraction by a strong enough force. And so forth.

Wrong again, Rick. They are not “based on” either an understanding or lack of understanding of control systems. They are “based on” system dynamics, which subsumes control systems.

I read the book review you linked to, which includes the following statement:
" we can use the tools of control theory (linear systems analysis, Bode plots and so on, which are described so well in Control theory for humans ) to evaluate how well this control is being carried out." You approve of these tools “of control theory” (more generally, of system dynamics). Yet you reject another useful system-analytic tool for visualizing control system behavior–phase portraits–by making spurious claims about them not being an appropriate technique for analyzing control systems.

Phase portraits simply describe a dynamic system’s behavior over time, based on a mathematical model of the system under analysis. If your model is that of a control system and its environment (including disturbances), then phase portraits based on the system’s variables will describe the behavior of the control system with respect to those variables. Such portraits can reveal interesting properties of the system, such as regions in which the system will stabilize at or near its reference value versus those in which it will go into oscillation or even behave chaotically. (You might observe such a portrait when varying the loop gain of the system or delays around the loop.) Given its usefulness in this regard, I am at a loss to explain your rejection of phase portraits for describing control-system behavior.
Cheers,
Bruce

Nice paper, thanks Bruce, I liked the historical overview. I haven’t used phase diagrams in tuning control systems. I suppose I’ve used speed over time and position over time separately, I’ll give them a go sometimes.

What do you think about the Gaia hypothesis (p. 23)? There are dynamic system that receive external energy from the Sun, but are there control systems?

I was going to bemoan my persistent inability to be right when I realized that the system dynamics on which these analysis techniques are based are the dynamics of physical variables. So they work when the variables being controlled as the variables that are part of the physics model of realty. I’m pretty sure that these system dynamics no longer apply when we are dealing with systems that control variables that are complex functions of these physical variables; variables like the sequences and programs that are controlled in my demonstrations (here and here) of control of higher level perceptual variables.

I don’t reject any of the analysis tools you like; my complaint about your approach to understanding living control systems is that you leave out the most important analysis tool; the one that should be the first tool you use in the analysis of the behavior of a living control system: the test to determine the variable(s) it is controlling, if any.

Which is fine. I just don’t think they tell you much of interest unless you know what variable is being controlled. Which you probably do know pretty well in the case of the simple physical variables you are dealing with.

Thanks, Adam. I’ve long viewed the presence of life on Earth as a stabilizing factor, but I see it as establishing an equilibrium system, not a control system. There’s no reference value, not even an implicit one. In fact, at one point in Earth’s history the Earth was entirely covered with ice.

In this equilibrium system, pants and certain forms of bacteria break down carbon dioxide and release oxygen; animals and “decomposers” remove oxygen and release carbon dioxide. As carbon dioxide builds up in the atmosphere, plants flourish (up to a point, at least), increasing oxygen concentration and lowering carbon dioxide. As oxygen concentration increases (up to a point), animals flourish, taking up oxygen and increasing carbon dioxide concentration. Thus there is negative feedback between atmospheric oxygen and co2 concentrations. Similarly, increased atmospheric co2 raises the Earth’s surface temperature through the “greenhouse” effect; the resulting “hothouse” Earth increases plant production, reducing oxygen concentration.

I speculate that the difference between the fates of Earth (hospitable to life here) and Venus (Earth’s “twin” but a veritable Hell) may have been a failure of life to develop on Venus (or to develop sufficiently early enough) to counteract rising co2 levels. Instead, co2 levels continued to build, and that, together with the greater input of solar radiation, led to a runaway greenhouse condition, with surface temperatures on Venus now hot enough to melt lead.
Cheers,
Bruce

By those potentially “complex functions of physical variables” I assume you refer mainly to PCT’s perceptual signals. Perceptual signals (and other variables that are complex functions of other variables) are just variables like any other in a dynamical systems analysis, and as amenable to such an analysis as any other variables. And by the way, perceptual signals are physical variables, so the distinction you are trying to enforce between physical variables and “complex functions of these physical variables” fails on that account. Since when are perceptual signals in the nervous system not physical variables?

Heylighen’s use of phase portraits illustrates the differences in behavior of control systems versus other systems with feedback (positive or negative) and suggests that such diagrams can serve as useful analytic tools. Contrary to your assertion, creating phase portraits does not fully describe MY approach to understanding living control systems. I agree, of course, on the importance of the Test for controlled variables, but the Test was not the subject of this discussion. When investigating living control systems there are many tools one can apply to the task, and those include, for example, simulations, robots, Bode plots, Laplace transforms, time-series plots (time domain), Fourier analysis (frequency domain), system identification, phase portraits, and various neurophysiological techniques such as brain stimulation and recording via micro-electrode arrays, whole-brain imaging such as fMRI, gene deletion, calcium-channel photoactivation, and many others.
Cheers,
Bruce

No. I was referring to the higher level perceptual variables, such as sequences and programs (control of which is demonstrated in one of my on-line demos), that are hypothesized in B:CP as among the types of perceptual variables controlled by humans. These variables are defined over time and I think an analysis of the control of such variables would affect how one would interpret the results of conventional dynamic analyses of the behavior of a system that controls such variables.

I was under the impression that the Powers perceptual control hierarchy consisted on the perceptual side of perceptual functions that took in a number of inputs from lower-level perceptual functions (or directly from sensors) and output a value that was compared with a reference value. I was also under the impression that this was true at all levels, all the way to the top of the hierarchy.

If my impression of the hierarchy as discussed in B:CP and later material by Powers is anywhere near correct, there are perceptual functions for sequences and programs (among all else that we perceive). If there are, these perceptual functions at any moment are outputting a value. The current magnitude of this value and its derivative can be used in a phase plot, exactly like any other.

What’s the problem?

A phase plot is used to evaluate the performance of a control system, which you can’t do until you know what variable the system is controlling. That’s not a big problem when evaluating the performance of an artificial control system since those systems are built to control particular variables, so what the system is (or should be) controlling is known and the phase plot can be used to suggest ways to tune it up.

With living systems, we don’t always have a good idea of what variables they are controlling. This is particularly true for the more complex variables people control, like sequences and programs. But even when you know that a person is controlling, say, a sequence, the problem for making a phase plot is that the controlled variable is defined over time. A phase plot is a plot of the rate of change in a controlled variable as a function of the current value of the variable.

The current value of a sequence doesn’t exist until the sequence is complete. So you have to know what sequence the system is controlling in order to know when the calculation of the present value of that sequence exists. This may be doable – you might be able to determine the proper time window for calculating the present value of such a controlled variable – and if you can get the present values you can also estimate rate of change.

But getting a phase plot of such a controlled variable would certainly be problematic – and would have to start with the TCV to determine what variable you were dealing with. And it’s not clear what a phase plot would mean for such a variable anyway.

But if you like phase plots maybe it’s worth the trouble. If you actually tried to develop phase plots for controlled variables that are defined over time it might provide a good start to developing models of how such variables are controlled.

There’s a misunderstanding, right there. A phase plot doesn’t evaluate anything. It describes, and that’s all.

This is the equivalent of saying that you can’t understand how a simple control loop works until you know that the perception being controlled is the depth of water in a particular person’s bathtub.

Really? That certainly is not how most users of phase plots interpret them. Let’s try an analogy. A circle is sometimes described as the locus of points equidistant from a given point. That means that a circle plotted as a graph in orthogonal dimensions {x,y} when the “given point” is at {0,0} has the analytic property that every point on the circle of radius d conforms to sqrt(x2+y2) = d, and all points in the space that have this property lie on the circle.

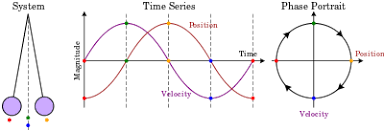
A phase plot is likewise a locus describing the behaviour over time of some variable. Usually, in an x,y plot, “x” represents the value of the variable and “y” represents its derivative. The value of a variable and of its derivative are uncorrelated, though not unrelated. For example, if the derivative,represented by “y” is positive, then “x” is trending in an increasing direction.

None of this depends on what the variable represents or whether it repeats over time. If it does, the phase plot is a closed loop, and quite probably an attractor.

That’s not true either. What the perceptual function (whatever kind of perception it might be) reports at any moment is how similar are the patterns of what its inputs are and have been to whatever it was built to detect.

For example, imagine a sequence detector tuned to the sequence “ABCD…”. When it detects any of these letters, say “B”, its input pattern is more similar to that than it would be if it detected “Z”. If it next detects “C”, the similarity — the value output as that of the current perception — is increased. If it next detects “D” the value is also increased, but by less. It’s increased rather than decreased because there is always the possibility that either the letter detector or the originator missed a step.

Anyway, the point is that all the way through a sequence of events detectable to the senses, every sequence perceiving input function is outputting a value, and if the perception of a particular sequence is being controlled for, the corresponding sequence perception has a reference value and an error value at all times. Either, or any other variable in the sequence control loop could be shown in a phase plot.

I suppose that’s a plausible suggestion. Certainly when you are driving and controlling to keep in your lane, your actual track is defined over time, and a phase plot of, say, your deviation from the lane centre might well suggest whether you had some hidden psychological or physiological problem.

Of course. I said a phase plot is used to evaluate, not that the phase plot itself evaluates.

No, it’s not like saying that. But if thinking that works for you then go for it.

I was just going with the way Bruce defined it.

Best, Rick

Yes, I did omit “used” in my comment. I meant to say that it is a complete misunderstanding to suggest that a phase plot is used to evaluate.

[quote=“rsmarken, post:31, topic:15901”]

Really? I can’t find anywhere in the thread that Bruce defined a phase plot.
Maybe you could quote it.

From my search today, he talked a lot about the broader concept of a phase portrait, which includes all possible phase plots using the same variables, and includes the important concept of the “basin of attraction” with its attractor. A basin of attraction includes the effect of any disturbance, including an overwhelming disturbance. The whole phase portrait may include several basins of attraction, including boundary curves between basins that define unstable conditions such as a pencil standing on its point.

I’m trying not to get involved in yet another limit cycle attractor in the form of an argument with you, but I’m glad you did bring that form of argument to my attention, because I noticed that I had not covered it in writing about protocols. I have now begun to draft a section, maybe two, on the contrasting forms of argument, which I call “Truth Seeking” in which the point of the argument is to bring the arguers to agreement about something, and “Political” in which the point of the argument for at least one party is not to change the other party’s position, but to cause bystanders to believe whatever that party controls for them to believe.

I perceive the cycle that seems to be an attractor when Rick and I interact to take the form of a political argument. The attractor of a truth-seeking argument is not a cycle, but a limit point of mutual agreement. Personally, I do not control for perceiving myself to be participating in a political argument, so I tend to stop participating in what I perceive to be one.

So what is it used for?

Well this user did:

image

Maybe it’s the term “controlled variable” that threw you off. The variable plotted in a phase plot is typically a controlled variable when describing the behavior of a control system. When describing the behavior of a non-control system the variable plotted in a phase plot is just a “variable”, like the position of the pendulum in the plot above.

Best, Rick

One of the phases of the cyclic political argument, at least the ones you have historically engaged in with me is for you to tell me what I told you as though it is somehow new to me. I’m not going to play along any more this time.

However, I do note that the diagram composer uses “portrait” where I would use “plot”. I wonder what word s/he would use for the entire domain for which I use the term “portrait”? And what would the phase plot for a physical double-pendulum governor look like in the absence of an energy source? (Hint, the attractor is a fixed point).

Supposing the radius of the circle is 1, tell your fans the value of the derivative when the position is 0.5, and when it is 2.0. Your function should produce one answer. Such a function can be written, but it is not the usual one used to describe a circle. I don’t plan to give you the answer, but I expect you can get someone to tell you if you can’t work it out.

Find a real technical point and I will rejoin this thread. Otherwise, not.