[Eetu Pikkarainen 2017-10-16]
Dear Boris,
thank you for commenting!
I really didn’t mean that diagram as any general replacement of classical Powers diagram but rather as a temporal practice to consider the symmetry / asymmetry question of the control
loop. For that it worked well at least for me and perhaps it can have other uses too. I don’t think that it is in any way contradictory with the classical diagram.
I would like to hear what kind of feed-back function there is in sleeping?
Best
Eetu
···
Lähettäjä: Boris Hartman [mailto:boris.hartman@masicom.net]
Lähetetty: 15. lokakuutata 2017 11:26
Vastaanottaja: csgnet@lists.illinois.edu
Aihe: RE: A/symmetry of control (was Re: Causality (was Re: Behavioural Illusion))
Dear Eetu…
From: Eetu Pikkarainen [mailto:eetu.pikkarainen@oulu.fi]
Sent: Friday, October 13, 2017 9:03 PM
To: csgnet@lists.illinois.edu
Subject: A/symmetry of control (was Re: Causality (was Re: Behavioural Illusion))
[Eetu Pikkarainen 2017-10-13 2]
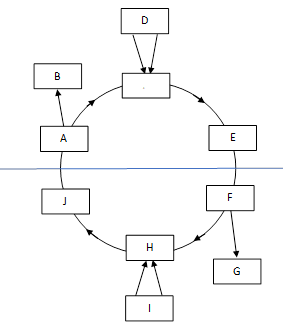
EP (from now on): I started to think about that symmetry / asymmetry question which has intrigued me also earlier. To make it more clear is draw this funny symmetric diagram which can turned around if you wish:
EP : This is not very adequate and perfect diagram because the wire labels and functions are not differentiated. The boxes are rather just points in the diagram. (Label “C� has vanished in conversion.) I try next describe
what I mean with these points by starting randomly from A and assuming that subject is above and environment below the vague blue line.
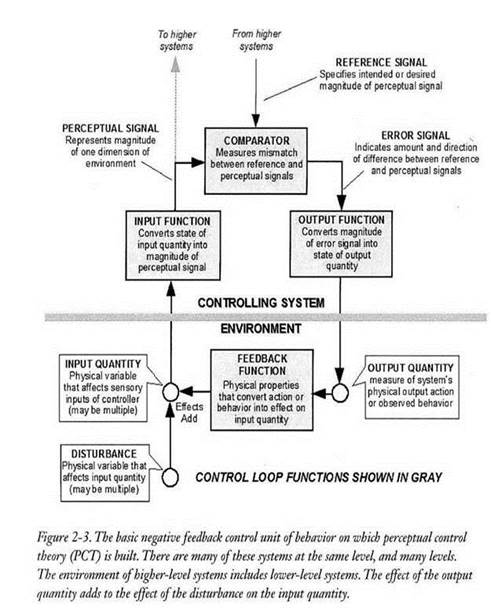
HB : Diagram is different from Bills (LCS III) and it’s not general. It can’t serve for interpretation of all possible behaviors. ‘H’ is not in Bills’ diagram. It’s ‘H’ or ‘I’ that is affecting
‘J’. ‘J’ in Bills’ diagram represent IQ or “input quantity� as added effects of disturbances and output. And there is just “feedback function� in environment of “control unit�. I think that “IQ� is imagined.
Bill P : FEED-BACK FUNCTION : The box represents the set of physical laws, properties, arrangements, linkages, by which the action of this system feeds-back
to affect its own input, the controlled variable. That’s what feed-back means : it’s an effect of a system’s output on it’s
own input.
HB : The best way to test any diagram is to think of an example of behavior. If you are sunshining the sun light will fall on your skin (perceptual input) and muscles (behavior) will be used to affect
input quantity (the amount of sunlight or electromagnetic waves on the input, skin). So outside is only feedback function : effects of output on input as Bill assumed and disturbances. The same is with sleeping. So with this two examples you solved the problem
how organism function (and thus your diagram) for at least 10 hours a day if you are on vacation. So think of all other examples of behavior and match them to Bills’ diagram, so that you’ll fill the whole day 24/7. And I’m sure on the end you’ll be convinced
that Bill was right.
PCT diagram is general. It should explain any behavior. You don’t need to invent any other diagram. So the best way to test whether PCT diagram is right or not is to test any “real� behavior through
its’ control loop (LCS III) and if anybody proves any deviations, Powers ladies should be asked for changes in diagram. I have no problem in explaining any behavior through existing PCT control loop (LCS III). Why inventing new control loop in every séance
?
Best,
Boris
A: Here is the perceptual function which converts some environmental effect (stimulus, irritation) to a perceptual nervous signal which is then sent forward via probably many nerves. The individual nerves can carry different
signals but they have an average strength which depends (among others) on the strength of the original effect. The signal branches to B and C.
B: If the controller is an elementary control unit then the perceptual signal is sent at least to some other units above it in the control hierarchy. If the controller is a highest unit in the hierarchy or the diagram
depicts the whole subject as one control system then this branch is probably missing.
C: (Empty box in the picture.) This is the comparator function where the perceptual and reference signals are compared and the error signal produced as a difference (remainder) between perceptual and reference signals.
D: This box refers to some other control units which are higher in the hierarchy. They send their output as reference signals to C. The signals they send can have combined effects and in the case of internal conflict
they can more or less cancel each other (see Powers: MSB p.74-).
E: Here is the output function which is a kind of an amplifier. It converts the error signal to some kind of environmental force as an output. The strength of the output depends on the strength of the error but is amplified
or gained(?). It can typically also realize a time integration so that the force of the output grows from zero (or earlier output level) gradually and continues growing as long as the error remains.
F: This is usually called the environmental feedback function. I understand that it means the environmental causal chain through which the effects of the output is mediated forward inside the loop. I guess the nature
of this chain can increase or decrease the loop gain so that certain kind of chain can enable stronger consequences with less output. For example tools can be such mediators, or feedback links.
G: This box refers to (immediate) side-effects of the output. In a way these immediate side-effects lessen the efficacy of the output as a wasted energy. But there are also mediated side-effects: the output changes the
situations in the environment and thus the conditions of many (all?) environmental processes will change which can more or less turn the course of those processes away from what they had been if that output had not happened. (“Everything affects everything.�)
H: This is the CEV or the complex environmental variable which (presumably) corresponds to (and is responsible for) the environmental effect which is converted to perceptual signal in A. This variable is a (possibly complex)
feature of one object or of a complex of objects. The feedback chain consists of objects whose certain properties make them interact together and thus form the links of the chain and CEV is one of these links.
I: Here are the incoming branches of the feedback chain and they together form the disturbance. The value of CEV is determined by the combined effects of all these branches and the output. Here like with references these
disturbance effects can strengthen or weaken each other. They typically are thought to be opposite to the output but some effects can also be concurrent and thus strengthen the effect of output to the CEV.
J: This is not usually drawn in PCT diagrams. This is the end of the feedback chain which happens to be after the CEV. For example these links could be something like newspaper, mirror, microscope or any other mediators
or chains of mediators via which the effect of the CEV receives the controller. Sometimes there is perhaps none. F and J could be called the output part of the feedback chain and the input part of the feedback chain, respectively.
Now if we look at the seeming symmetry of the loop: C and H with incoming branches are very similar, only error is the (theoretical) sign conversion in C. Practically this sign conversion seems to happen more in the environmental
side. (?) A and F with outgoing branches are very similar. The biggest apparent difference is between E and J. For E it is important that it amplifies the signal strongly enough. Instead for J it is important that it does NOT change too much and distort the
original effect of the CEV.
This is the formal answer to my old problem what justifies that in the theory of action we look at the interaction between subject and environment from the point of view of the subject.
Eetu
Please, regard all my statements as questions,
no matter how they are formulated.