RM: I did think them through but I think I understand why you would reject them.
I reject them because I see where they would fail and where they are underspecified. You would see the same if you would actually try yourself the experiments that you suggest to me.
RM: But there is certainly a mathematical relationship between those variables and that mathematical relationship will show up in a regression analysis when the “third variable” is included in the analysis.
You have one equation relating three variables, not two, and the multiple regression simply returns you the equation that you set up. You should by this point really start doubting your feeling of certainty when it comes to math. I do doubt mine very much, and only get confident after several independent lines of reasoning lead to the same conclusion - algebra, simulations, physical intuition, etc.
What gives you the confidence to say that the relationship is certain?
RM seemed to me that when I was talking to you I was hearing Martin Taylor’s arguments (augmented with some actual modeling and data)
You do have a strange obsession with Martin Tayor. Though, you had some weird comments on how Bruce Abbott’s diagrams of the control loop are not good. It comes off pretty nasty, from my perspective.
Richard Kennaway did not put the reference signal for the cursor-target position, which Viviani explicitly mentioned as being zero, I’ve quoted the lines somewhere above.
RM: And as far as the substance of your arguments, they may have been logically sound and you certainly presented “…control loop diagrams, empirical data, models, simulations, the whole shabang”. But I didn’t find them very convincing.
But you did find them convincing. At various point in this discussion you agreed with my explanation of the behavioral illusion, you agreed that your definition of the behavioral illusion in the first power law paper was not correct; you agreed that that side effects are not behavioral illusions; that side effects do reflect properties of the loop; that the power law is not a statistical artifact. You flipped those opinions several times back and forth. What is going on?
Since we are talking about diagrams, it is a good time to bring up your diagram of the COV model from the helicopter tracking. I find it really inconsistent. Of course, the code of the model is probably fine, since it does reproduce the behavior of human subjects, but the diagram has a few mistakes.
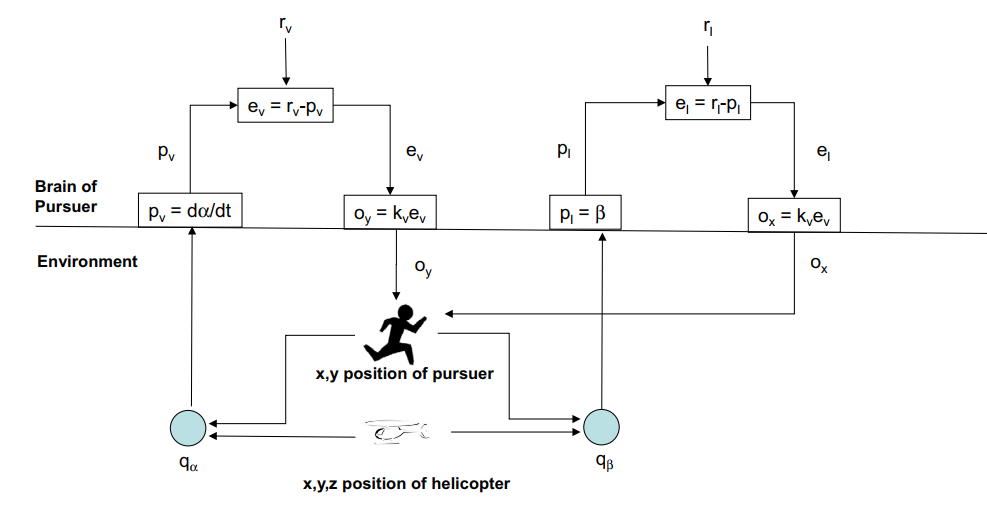
So first off, left perceptual function seems to be a differentiator, looking for some angular velocity, and the right one is just an angle. Is this correct?
Second, the controlled variable symbol q_alpha and q_beta is under the environmental function that is adding the disturbance and the behavior. Is this intentional or an error? The controlled variables should be marked next to the lines that represent them, which are the lines entering the input functions, not the box that is just adding the disturbance and the behavior output.
Maybe the q_alpha is the environment projective geometry function, relating x,y, z position of the helicopter to some retinal angles, and the alpha and beta are the controlled variables?