I sent this a while ago and it has not arrived at CSGnet, although my subsequent messages have. My apology if this is now a repeat.
Bruce
[From Bruce Abbott (2016.08.11.1635 EDT)]
While Rick is grappling with the work I asked of him in my previous post, here is a new spreadsheet that illustrates the problem with Rick’s claim that the Power Law relating velocity to radius of curvature is a statistical artifact of the equations used to compute V and R. What it demonstrates is that Rick’s results are an artifact of the way his spreadsheet creates an ellipse.
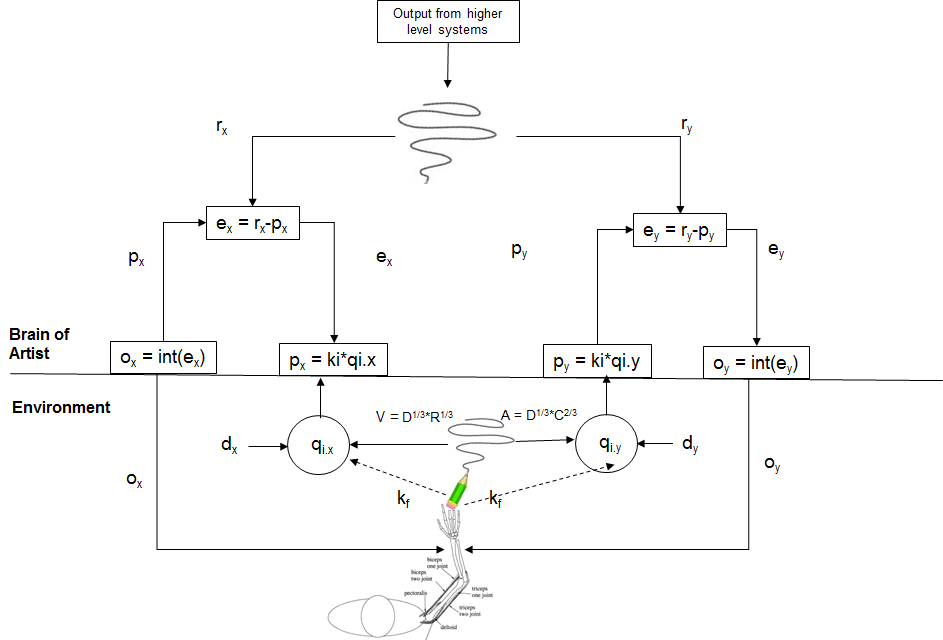
The spreadsheet presents three figures based on a quarter of an ellipse in which the X dimension is ±15 and the Y dimension is ±10. (You can change these dimensions by entering new numbers for these values.) The ellipse is drawn as Rick does, incrementing the central angle (call it “theta”) at a constant rate per iteration (each line in the spreadsheet is an iteration). In my case the increase is at the rate of one degree per iteration. The degrees are converted to radians (because the spreadsheet sine and cosine functions expect radians) and then plugged into formulas giving the x,y positions of points along a unit circle as follows: x = cos(theta); y = sine(theta); The x value is then multiplied by the width factor (15) and the y value by the height factor (10) to produce a point along the ellipse for each increment of 1 degree of central angle. The points move counterclockwise around the first 90 degrees of the ellipse.
This method of creating an ellipse enforces a specific relationship between the ellipse’s radius of curvature R and the distance moved along the perimeter of the ellipse with each equal increment in angle. At the start, when x = 15 and y = 0, incrementing theta by 1 degree moves the point nearly vertically along a small radius of curvature. But as the degrees cumulate, the curvature diminishes and more and more of the movement of the point is in the y direction, and less in the x direction. By the time we reach the top of the ellipse at 90 degrees, the movement is entirely horizontal, y being at its maximum value of +10.
The “velocity” of the point, V, is the distance along the ellipse it moves with each increment of one degree. Note that this has nothing to do with time, it is tangential distance (distance along the perimeter) divided by degrees.
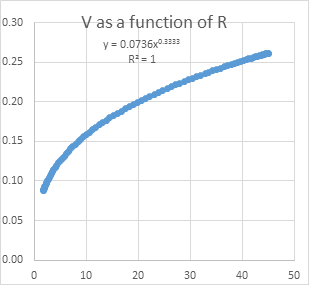
The first figure shows the quarter-ellipse being drawn using the X and Y dimensions of 15 and 10 respectively and incrementing by 1 degree per iteration. The second figure shows how V changes as a function of R on linear scales. A power function has been fit to the data and R2 equals 1.0. The R is raised to the 1/3 rd power and there is a multiplier of less than 1 that is probably an artifact of the use of simple difference scores to compute velocities and accelerations. The third figure presents the same data on log-log coordinates, with a linear function being fit to the data. This yields a Beta of 1/3 rd and a log intercept close to one. Again the R2 is 1.0.
Here is the second figure, on linear scales. This function emerges when both V and R depend on cumulated degrees as one sweeps out the quarter-ellipse. Other methods of creating an ellipse will not produce this relationship. For example, moving along at a constant tangential velocity would not produce it (because V is then a constant), nor would, for example, speeding up on sharper curves and slowing down on more gentle ones.
The particular method of drawing the ellipse using constant increments in theta is responsible for enforcing this relationship between V and R (or log V and log R). It causes the points along the perimeter of the ellipse to spread apart more and more as we move from 0 degrees to 90 degrees, covering more tangential distance and thus going at a higher “velocity” in distance/degree. You will have to drag some of the figures aside to see it, but examination of the numbers shows this to be the case as well.
When Rick does his computations, he increments time by a constant amount with each iteration, dt being 1/120 seconds. With each increment of time, he increments the central angle by a constant amount. Each increment in central angle changes the position of the point along the ellipse by an amount that depends on where the point is currently located, just as in my version. Degrees of increment being directly proportional to time, we have time/increment being converted to degrees/increment, and the computed tangential velocities must change with the radius of curvature as they always do when an ellipse is being drawn this way, incrementing theta a constant amount per iteration. The relationship is a characteristic of ellipses being created in this way.
The data Rick refers to when claiming that the 1/3 power law is just a statistical artifact of the way R is computed (as a function of Velocity plus that pesky “D” variable) are not empirical data in which V could be practically anything while drawing an ellipse. For example, it should be easy to sketch an ellipse while moving the “pen” at a constant velocity around the ellipse or at random variable velocities and the data would not be forced to conform to the 1/3 power law that appears when sketching the ellipse at a velocity that depends on incrementing theta by a constant amount per iteration, as it must using Rick’s method of tracing out an ellipse.
By the way, if you examine “D” in my spreadsheet you will find that it is constant. This explains why R-sq is 1.0 without needing to add D as a variable to the regression.
In a previous post I demonstrated that creating a circle using the same method (incrementing theta by a constant amount per iteration) does not produce data that conform to the power law (because both V and R and constant.) On that fact alone, Rick’s claim that the power law is a statistical artifact of the way V and R are computed in published research and will always have Beta = 1/3 (so long as you include D in your regression) has already been falsified. Circular arcs don’t conform to the power law, no matter how they are drawn (because R is constant).
Sorry Rick, the published power law is not an artifact of the way V and R are computed in published research. It’s an artifact the way V and R were computed in your spreadsheet. You’ve been misled by the fact that ellipses drawn this way conform to the power law with beta = 1/3. Actual data, where V is not constrained to vary with R in any particular way, do not have to follow the 1/3 power law or any other, even when drawing ellipses. Which makes it interesting that they so often do!
Bruce
Ellipse 1 degree per iteration.xlsx (60.9 KB)