Model of "Collective Control" of Pronunciation Drift

[Rick Marken 2018-11-22_11:24:30]

RM: Happy Thanksgiving All.

RM: I’ve got a few hours before the Thanksgiving dinner so I thought I would tell you about a little control model I’ve written (in Excel) to provide a start at explaining the phenomena of pronunciation drift described in the Labov article posted by Burce N. My model was very simple – 10 people in two different, non-interacting populations – Up and Down Islanders. Each person in each population starts with a slightly different way of pronouncing /au/ in terms of centralization index (CI) but the average CI value in the two populations starts out the same.Â

Each person in each population is controlling for pronouncing /au/ in the same way as the person they are currently closest to. The proximity between all the members of the population is constantly varying so everyone is controlling for pronouncing in a way that is consistent with the pronunciation of a different person at different times.

Here is the result of one run of the model, showing the variation in average CI over time in the two populations:

Â
Picture11.png

On this run the Up Islanders converge to a CI average close to .66 and the Down Islanders converge to a CI average close to .33, which are the actual values found by Labov, as shown in the table below.Â

image529.png

RM: But this is not always the result. Sometimes the Down Islanders end up with the high CI value, as shown here:

Picture21.png

RM: So going just on proximity alone, the model predicts that the two populations could have converged at different pronunciations of /au/. But what’s most interesting about the model is that it does show that people who are just controlling for pronouncing like the people around them, all of whom initially pronounce things slightly differently, will converge to pronouncing these things about the same.Â

RM: Anyway, I found this kind of an encouraging start to building a model of pronunciation drift that could account for all the data in the Lubov article and make predictions about what what kind of data to collect or look for to further test the model. Comments and suggestions are welcome (I’m NOT looking at you, Boris;-)

RM: Now back to football and turkey.Â

BestÂ

Rick

···


Richard S. MarkenÂ

"Perfection is achieved not when you have nothing more to add, but when you
have nothing left to take away.�
                --Antoine de Saint-Exupery

My comment - I love it! Parsimony at its best!

So would you think that the system control, if it exists, maybe comes in at a later stage once the differences are distinct and maybe applies to other low level distinctions too (e.g. dressing differently; having different slang; preferring different foods, etc)? Finally, is the different sound a different reference value? If so, is the model effectively ‘internalising’ the closest other persons sound as their own reference value? So this would require the memory component within a PCT loop, rather than reorganisation to account for change?

All the best,

Warren

···

On 22 Nov 2018, at 19:27, Richard Marken (rsmarken@gmail.com via csgnet Mailing List) csgnet@lists.illinois.edu wrote:

[Rick Marken 2018-11-22_11:24:30]

RM: Happy Thanksgiving All.

RM: I’ve got a few hours before the Thanksgiving dinner so I thought I would tell you about a little control model I’ve written (in Excel) to provide a start at explaining the phenomena of pronunciation drift described in the Labov article posted by Burce N. My model was very simple – 10 people in two different, non-interacting populations – Up and Down Islanders. Each person in each population starts with a slightly different way of pronouncing /au/ in terms of centralization index (CI) but the average CI value in the two populations starts out the same.

Each person in each population is controlling for pronouncing /au/ in the same way as the person they are currently closest to. The proximity between all the members of the population is constantly varying so everyone is controlling for pronouncing in a way that is consistent with the pronunciation of a different person at different times.

Here is the result of one run of the model, showing the variation in average CI over time in the two populations:

<Picture1.png>

On this run the Up Islanders converge to a CI average close to .66 and the Down Islanders converge to a CI average close to .33, which are the actual values found by Labov, as shown in the table below.

<image.png>

RM: But this is not always the result. Sometimes the Down Islanders end up with the high CI value, as shown here:

<Picture2.png>

RM: So going just on proximity alone, the model predicts that the two populations could have converged at different pronunciations of /au/. But what’s most interesting about the model is that it does show that people who are just controlling for pronouncing like the people around them, all of whom initially pronounce things slightly differently, will converge to pronouncing these things about the same.

RM: Anyway, I found this kind of an encouraging start to building a model of pronunciation drift that could account for all the data in the Lubov article and make predictions about what what kind of data to collect or look for to further test the model. Comments and suggestions are welcome (I’m NOT looking at you, Boris;-)

RM: Now back to football and turkey.

Best

Rick


Richard S. Marken

"Perfection is achieved not when you have nothing more to add, but when you
have nothing left to take away.�
–Antoine de Saint-Exupery

[Martin Taylor 2018.11.23.10.12]

[Rick Marken 2018-11-22_11:24:30]

RM: Happy Thanksgiving All.

              RM: I've got a few hours before the

Thanksgiving dinner so I thought I would tell you
about a little control model I’ve written (in Excel)
to provide a start at explaining the phenomena of
pronunciation drift described in the Labov article
posted by Burce N. My model was very simple – 10
people in two different, non-interacting populations
– Up and Down Islanders. Each person in each
population starts with a slightly different way of
pronouncing /au/ in terms of centralization index (CI)
but the average CI value in the two populations starts
out the same.

Very neat!

              Each person in each population is

controlling for pronouncing /au/ in the same way as
the person they are currently closest to. The
proximity between all the members of the population is
constantly varying so everyone is controlling for
pronouncing in a way that is consistent with the
pronunciation of a different person at different
times.

              Here is the result of one run of the model, showing

the variation in average CI over time in the two
populations:

                On this run the Up Islanders converge to a CI

average close to .66 and the Down Islanders converge
to a CI average close to .33, which are the actual
values found by Labov, as shown in the table below.

The crossover at around time 45 is interesting.

  I don't know whether it is relevant to the specific issue you

looked at, but it’s good to remember that if people control at all
for making their pronunciation resemble that of their neighbours,
it might at first be seen as control of output, but it need not
be. Presumably when one uses a word, one does so in order to
control some perception, using the other person as the functional
equivalent of a tool. If the word doesn’t work very well,
reorganization would vary the linkages all the way down to the
lower level control units that control perceptions of muscle
tensions, until the pronunciation of the word was sufficiently
intelligible to the listener that using the word has the desired
influence on the talker’s controlled perception.

  Looked at this way, the convergence of pronunciations with the

neighbours is a side-effect of controlling whatever is controlled
by using words that contain /ai/|/au/. I imagine Bruce will
disagree with me on this, but I think that one’s perception of
one’s own speech differs enough from one’s perception of the
speech of others to make perceptual matching rather unreliable in
detail, though it can be good as a gross guide. It is a skill that
seems to be learnable, because if it were not, we would not have
entertainers who are famous for their mimicry ability.

Martin

                RM: But this is not always the result. Sometimes

the Down Islanders end up with the high CI value, as
shown here:

                RM: So going just on proximity alone, the model

predicts that the two populations could have
converged at different pronunciations of /au/. But
what’s most interesting about the model is that it
does show that people who are just controlling for
pronouncing like the people around them, all of whom
initially pronounce things slightly differently,
will converge to pronouncing these things about the
same.

                RM: Anyway, I found this kind of an encouraging

start to building a model of pronunciation drift
that could account for all the data in the Lubov
article and make predictions about what what kind of
data to collect or look for to further test the
model. Comments and suggestions are welcome (I’m NOT
looking at you, Boris;-)

  Good work. I encourage continuation of the effort, perhaps taking

into account the differing likelihood of encountering various
people, such as the more frequent contacts within a family than
with village neighbours and shopkeepers, and people in nearby as
opposed to distant villages. Maybe a look at network models of
infection might be useful, too.

Martin

[Rick Marken 2018-11-24_10:14:44]

RM: Thanks for all the nice comments. But it turns out that the model results are plotted were based on a faulty model. My mistake was small by crucial: I basically got the error calculation in the model wrong so that the result was a positive feedback loop which I had limited by limiting the perceptual input to be no greater than the limits found in the data. I discovered this error while trying to think of how to get the model to converge to CI averages other than .66 and .33.Â

RM: When I fixed the model, things went even better than they had with the original, incorrect model. Here’s the results of one run:

RM: The reason this result is better is that the model converges (by chance) to different CI values on each run. The graph above shows only on result; the model converges to quite different values for the Up and Down Islanders on each run. This is a feature, not a bug, because it can account for the differences in CI averages for the subgroups in the Up and Down Island groups, as in this table:

Â

RM: Anyway, there is much more to do with the model. The main thing being to see if control for matching pronunciation based on variables besides proximity alone – such as the prestige of the speaker – would get the model to the different observed difference in average CI.Â

RM: This is really interesting stuff and I would really like to keep working on it. But I’ve got other priorities at the moment but I could elevate the priority of this work if I could get a linguist or sociologist to work on it with me.Â

BestÂ

Rick

image542.png

···

Richard S. MarkenÂ

"Perfection is achieved not when you have nothing more to add, but when you
have nothing left to take away.�
                --Antoine de Saint-Exupery

[Bruce Nevin 2018-11-24_20:03:40 UTC]

Rick Marken 2018-11-24_10:14:44Â --Â

Yes, this is much better. It’s a partial model of dialect divergence. Partial: as you say, among the conditions for emulation it includes only proximity. And it is unclear what is being controlled. It sounds like cause-effect: proximity to another causes convergence of an ‘internal’ value (more like an attribute) toward that of the other. You haven’t indicated how many approaches occur during a run that are close enough to trip this convergence of references. Observationally, change within a speech community is rather slow, typically requiring decades in stable social conditions. Are there enough ‘contacts’ for any given agent during a run to correlate with the number of speech interactions over a decade or so? A preference for approximating one kind of exemplary person and/or distancing oneself from the other kind of exemplar would have a slowing effect on the convergence.Â

Stepping back to naturalistic observation to speculate about potential variables, the rustic farmers and fishermen, found mostly and most often in the rural up-Island towns, but not at all exclusively or always, were viewed as quaint, authentic American … artifacts? … by visitors, admired for their hardiness, memorably painted by Hart Benton and others, but who would want to live that way nowadays. There they are, over there, see?Â

Those whose view was “Yes, I do want to live this way” had a similar observational distance from what my mother’s cohort called ‘summer ginks’. The performances of a soft city visitor who charters a fishing trip become the stuff of humerous anecdotes and jokes. You don’t want to be the butt of such humor if you’re a teenager especially. Not on a boat or in a field where you if say “It’s so cold, dad, I’m freezing!” he says gruffly “You’re not working hard enough” – kindly meant, for that is indeed how you stay warm in that kind of life. Success in that rural world requires interdependent mutual support, and appearing as though you think of yourself as being like those folks could put your reliability in question.Â

“In the old days,” I was told, “only the cows wanted a water view.” Those in the tourism bind (selling it erodes what you’re selling) couch their pitch from the visitor’s perspective. Old families with divided inheritance are forced to sell land because of taxes, which have gone up as the land values go up, the increase in value drawing speculators and flippers and teardown-to-mcmansion artists further driving up appraised values, and adding themselves and their values to the down-Island population. Construction becomes a major career option for young people. For every person you see here in the winter, there are 5 or 6 more people here in the summer, most of them bringing cars. Rents go up, people move out of their homes and camp to get the income, many families move in and out of winter rentals twice a year. (Presently, 80% of the Island’s housing stock lies vacant in winter while upwards of a hundred homeless people camp in the woods through the winter. The seasonal stresses were analogous at the time Labov was writing, though they had not yet reached these extremes.) Those who control self worth by means of controlling material wealth are among those who most emulate them. Seasonal merchants use the tourist economy as a money machine so they can live down south in the winter, perhaps aspiring eventually to be among the ‘summer community’ they serve.Â

More can be said about these painful distortions. I expect that a number of potentially controlled perceptions can be identified for testing or for indirect verification wrt documented observations. A fundamental reference is Milton Mazer’s People and predicaments: Of life and distress on Martha’s Vineyard, HUP 1976, dealing very closely with the time period of Labov’s observations.

RM: This is really interesting stuff and I would really like to keep working on it. But I’ve got other priorities at the moment but I could elevate the priority of this work if I could get a linguist or sociologist to work on it with me.  Â

Well, you’ve got one linguist here. Tell me what you need from me. Kent may be winding down or out into other engagements, but he might take an interest. Kent, might any of your students be interested?

image542.png

···

/Bruce

On Sat, Nov 24, 2018 at 1:15 PM Richard Marken csgnet@lists.illinois.edu wrote:

[Rick Marken 2018-11-24_10:14:44]

RM: Thanks for all the nice comments. But it turns out that the model results are plotted were based on a faulty model. My mistake was small by crucial: I basically got the error calculation in the model wrong so that the result was a positive feedback loop which I had limited by limiting the perceptual input to be no greater than the limits found in the data. I discovered this error while trying to think of how to get the model to converge to CI averages other than .66 and .33.Â

RM: When I fixed the model, things went even better than they had with the original, incorrect model. Here’s the results of one run:

image.png

RM: The reason this result is better is that the model converges (by chance) to different CI values on each run. The graph above shows only on result; the model converges to quite different values for the Up and Down Islanders on each run. This is a feature, not a bug, because it can account for the differences in CI averages for the subgroups in the Up and Down Island groups, as in this table:

Â

RM: Anyway, there is much more to do with the model. The main thing being to see if control for matching pronunciation based on variables besides proximity alone – such as the prestige of the speaker – would get the model to the different observed difference in average CI.Â

RM: This is really interesting stuff and I would really like to keep working on it. But I’ve got other priorities at the moment but I could elevate the priority of this work if I could get a linguist or sociologist to work on it with me.Â

BestÂ

Rick


Richard S. MarkenÂ

"Perfection is achieved not when you have nothing more to add, but when you
have nothing left to take away.�
                --Antoine de Saint-Exupery

Rick,

RM: Anyway, I found this kind of an encouraging start to building a model of pronunciation drift that could account for all the data in the Lubov article and make predictions about what what kind of data to collect or look for to further test the model. Comments and suggestions are welcome (I’m NOT looking at you, Boris;-)

RM: Now back to football and turkey.

HB : No kidding :blush:. As I see the situation it seems that you are getting to where Bruce Nevin wants you to go. You’ll probably get the conclussion that in avarage people in vicinity pronunce in the same way. So the conclussion will probably be that Bruce Nevins’ theory is right. The transmission in pronauciation is done with “perception of reference values”. You know what Bill thought about “statistical analysis”. And in PCT we know that “reference values” can’t be perceived.

Otherwise I’m used to your “insults” as you became used on mine :blush:. We understand each other quite well but it seems that others don’t understand. It seems that “reference values” can’t be transfered into niether of us. Not mentioning others. I can’t see anywhere any “transmission of reference values” from anybody to no one. Do you see them ?

It’s interesting with what PCT means I’ve tried to persuade you that Bills’ diagram and definitions of PCT control loop (“reference values”) are right and you simply didn’t adopt them (accept them through perception). It’s obvious that you are sticking to your internally produced and maintained “reference values” for how organisms function, which you created through your experiences (control loop) in your life forming your unique “reference values” in accordance to your organisms functioning.

Transfering “reference values” from me to you or from Martin to you simply doesn’t work. You are not learning in the sense Bruce Nevin wanted to present as you didn’t set any “internal reference” on the basis of “perceived reference values” from me or Martin. You even wrote articles based on your own references, although you probably knew that is risky. You have contiunued with your own theory (RCT) for years or better decades, because with own references which you are producing you guarantee perceptual stability. With “adopting” PCT or BNCT “reference values” you would probably lose stable “control” which is produced through your original references for organism’s “stability”. Only you know when you are controlling succesfully so why would you “adopt” any other “reference values”? You’ll probably “test” other possibilities when you’ll feel not succesfull in your actual perceptual control.

Anyway In your case BNCT theory of learning failed.

This time I’ll let you develope your theory without interfere unless you’ll start again with RCT :wink:.

Boris

image001194.png

image002109.png

image00337.png

···

From: Richard Marken (rsmarken@gmail.com via csgnet Mailing List) csgnet@lists.illinois.edu
Sent: Thursday, November 22, 2018 8:27 PM
To: csgnet csgnet@lists.illinois.edu
Cc: Richard Marken rsmarken@gmail.com
Subject: Model of “Collective Control” of Pronunciation Drift

[Rick Marken 2018-11-22_11:24:30]

RM: Happy Thanksgiving All.

RM: I’ve got a few hours before the Thanksgiving dinner so I thought I would tell you about a little control model I’ve written (in Excel) to provide a start at explaining the phenomena of pronunciation drift described in the Labov article posted by Burce N. My model was very simple – 10 people in two different, non-interacting populations – Up and Down Islanders. Each person in each population starts with a slightly different way of pronouncing /au/ in terms of centralization index (CI) but the average CI value in the two populations starts out the same.

Each person in each population is controlling for pronouncing /au/ in the same way as the person they are currently closest to. The proximity between all the members of the population is constantly varying so everyone is controlling for pronouncing in a way that is consistent with the pronunciation of a different person at different times.

Here is the result of one run of the model, showing the variation in average CI over time in the two populations:

Picture1.png

On this run the Up Islanders converge to a CI average close to .66 and the Down Islanders converge to a CI average close to .33, which are the actual values found by Labov, as shown in the table below.

image.png

RM: But this is not always the result. Sometimes the Down Islanders end up with the high CI value, as shown here:

Picture2.png

RM: So going just on proximity alone, the model predicts that the two populations could have converged at different pronunciations of /au/. But what’s most interesting about the model is that it does show that people who are just controlling for pronouncing like the people around them, all of whom initially pronounce things slightly differently, will converge to pronouncing these things about the same.

RM: Anyway, I found this kind of an encouraging start to building a model of pronunciation drift that could account for all the data in the Lubov article and make predictions about what what kind of data to collect or look for to further test the model. Comments and suggestions are welcome (I’m NOT looking at you, Boris;-)

RM: Now back to football and turkey.

Best

Rick

Richard S. Marken

"Perfection is achieved not when you have nothing more to add, but when you
have nothing left to take away.�
–Antoine de Saint-Exupery

[Rick Marken 2018-11-25_13:58:50]

[Bruce Nevin 2018-11-24_20:03:40 UTC]

Â

BN: Yes, this is much better. It’s a partial model of dialect divergence. Partial: as you say, among the conditions for emulation it includes only proximity. And it is unclear what is being controlled.

RM: In the model, what is being controlled is the difference between a person’s own pronunciation, call it pSelfCI, and the pronunciation of the currently closest other person, call it pOtherCI. So the controlled variable for each individual is pSelfCI-pOtherCI. The model equations for each individual are as follows:Â

System (person) equation:Â

Output (t) = Output(t-tau)Â + slow * (gain* (r - (pSelfCI(t) - pOtherCI(t))-Output (t-tau)Â Â Â Â Â (1)

Environment equation:

pSelfCI(t) = pSelfCI (t-tau) +Output(t) + d                                     (2)

The Output variable corresponds to changes in the configuration of the vocal tract that bring the perception of your pronunciation of /au/ to match that of the other person you are close to (and presumably talking to). The reference for the controlled perception, r, is 0 so the actual computer code for the system equation is:

Output (t) = Output(t-tau)Â + slow * (gain* (- (pSelfCI(t) - pOtherCI(t))-Output (t-tau)Â Â

RM: The values of slow and gain are the same for all individuals and selected to produce stable control. And d represents random disturbances to your own pronunciation of /au/, such as slight variations in the shape of the vocal tract like dryness and the amount of food in the mouth.

RM: So equations (1) and (2) are the model of each individual. Each individual is controlling the difference between how they and the person currently nearest to them pronounce /au/ in terms of CI index, and they are controlling for this difference being 0.Â

Â

BN: It sounds like cause-effect: proximity to another causes convergence of an ‘internal’ value (more like an attribute) toward that of the other.

RM: That’s why modeling is so important. A verbal description of the model may sound like cause and effect but with the model you can point to the equations and show that there is actually a closed loop of cause and effect which results in control of the difference between one’s own and the closest other person’s pronunciation of a diphthong.

Â

BN: You haven’t indicated how many approaches occur during a run that are close enough to trip this convergence of references.

RM: The convergence of the lower level references for pronouncing /au/ (a convergence that is implicit rather than explicit in this single level model) occurs via control for 0 difference between self and other pronunciation of /au/. This convergence is, thus, constantly occurring. What varies during a run is the distance between each individual and every other individual.

Â

BN: Observationally, change within a speech community is rather slow, typically requiring decades in stable social conditions. Are there enough ‘contacts’ for any given agent during a run to correlate with the number of speech interactions over a decade or so? A preference for approximating one kind of exemplary person and/or distancing oneself from the other kind of exemplar would have a slowing effect on the convergence.Â

RM: These are things that should be handled by extensions of the model, if the relevant data exists to know how it should be extended. Right now, all the model does is show that different groups, each containing people who are controlling for pronouncing a diphthong the way others in their group pronounce it, will converge to different, consistent ways of pronouncing the diphthong. In other words, it accounts for the data in Labov’s Table 3.Â

BN: Stepping back to naturalistic observation to speculate about potential variables…

RM: Interesting observations.Â

Â

BN: I expect that a number of potentially controlled perceptions can be identified for testing or for indirect verification wrt documented observations. A fundamental reference is Milton Mazer’s People and predicaments: Of life and distress on Martha’s Vineyard, HUP 1976, dealing very closely with the time period of Labov’s observations.

RM: Great. That could be useful, indeed.Â

RM: This is really interesting stuff and I would really like to keep working on it. But I’ve got other priorities at the moment but I could elevate the priority of this work if I could get a linguist or sociologist to work on it with me.  Â

BN: Well, you’ve got one linguist here.

RM: Super.

BestÂ

Rick

Â

image542.png

···

d Marken csgnet@lists.illinois.edu wrote:

[Rick Marken 2018-11-24_10:14:44]

RM: Thanks for all the nice comments. But it turns out that the model results are plotted were based on a faulty model. My mistake was small by crucial: I basically got the error calculation in the model wrong so that the result was a positive feedback loop which I had limited by limiting the perceptual input to be no greater than the limits found in the data. I discovered this error while trying to think of how to get the model to converge to CI averages other than .66 and .33.Â

RM: When I fixed the model, things went even better than they had with the original, incorrect model. Here’s the results of one run:

image.png

RM: The reason this result is better is that the model converges (by chance) to different CI values on each run. The graph above shows only on result; the model converges to quite different values for the Up and Down Islanders on each run. This is a feature, not a bug, because it can account for the differences in CI averages for the subgroups in the Up and Down Island groups, as in this table:

Â

RM: Anyway, there is much more to do with the model. The main thing being to see if control for matching pronunciation based on variables besides proximity alone – such as the prestige of the speaker – would get the model to the different observed difference in average CI.Â

RM: This is really interesting stuff and I would really like to keep working on it. But I’ve got other priorities at the moment but I could elevate the priority of this work if I could get a linguist or sociologist to work on it with me.Â

BestÂ

Rick


Richard S. MarkenÂ

"Perfection is achieved not when you have nothing more to add, but when you
have nothing left to take away.�
                --Antoine de Saint-Exupery


Richard S. MarkenÂ

"Perfection is achieved not when you have nothing more to add, but when you
have nothing left to take away.�
                --Antoine de Saint-Exupery

Bruce

image001195.png

···

From: Bruce Nevin bnhpct@gmail.com
Sent: Sunday, November 25, 2018 3:43 PM
To: boris.hartman@masicom.net
Subject: Re: Model of “Collective Control” of Pronunciation Drift

[Bruce Nevin 2018-11-25_14:32:17 UTC]

Boris Hartman Nov 25, 2018, 2:42 AM –

BH: in PCT we know that “reference values” can’t be perceived.

HB : First of all you wrote wrongly my initials. I’m presenting myself as HB. And I want that you all use it. Me and Rick know why.

BN : You mean that reference signals are not perceived by the organism that generates them.

HB : Are you kidding ? Vauuu what a genius conclusion what I meant. You must be a real master of sending “reference values” to other people and reading their minds. You probably have some courses for teaching people how to do it. Just send the terms when you are holding such spiritual seances.

Is there anybody on CSGnet that didn’t know that “reference signal” can’t be perceived. Maybe only Bruce Nevin is our “guru” who will show and explain us how to do it.

HB : But maybe we can also understand that you are saying that “reference signals” are somehow connected to “reference values”. Maybe you meant that “reference signal” are carrier of “reference values” which determine the reference level of the “controlled quantiy”. That’s maybe why and how observer could guess (TCV) what “reference value” could mean.

Anyway you are using odd BNCT terminology. Â

HB : Reference signal and perceptual signal are resulting in “error” signal which could have “value” you are talking about. But perceptual signal itself doesn’t carry solid information about “reference value”. If it exists it can be distributed over milions perceptual signals or nowhere.

Bill P (B:CP) :

…it si even more apparent that the first order perceptual signal rreflects only what happens at the sensory endings : the source of the stimulation is completely indefined and unsensed. If any information exists about the source of the stimulus, it exists only distributed over millions of first order perceptual signals and is explicit in none of them.

HB : So my conslussion was that “reference values” or whatever can’t be perceived as such.

Anyway it seems that you are inclined to such definition :

BN earlier : Yes, every participant in collective control is controlling individually. No present concept of collective control denies that. It may appear as though a ‘giant virtual controller’ is controlling, but that is avowedly a fiction that is convenient for some descriptive purposes. (And, personally, I don’t invoke it.

HB : “Reference values” or whatever it means are not “hanging arround” in space and time so you can’t perceive them.Â

Anyway Bill didn’t use terms you are using :

cid:image001.png@01D484DC.6C2F55A0

HB : Bill obviously used “reference level” and “reference signal” which are connected. So I’ll conclude that “reference signal” maybe in your language could determine the “reference value” for the controlled quantity. Otherwise “reference signal” is ordinary “nerv signal” with usual characteristics of nerv signals.Â

BN : A reference value is the value of a variable that is perceived to resist disturbances when one carries out the TCV.

HB : Where did you get this construct ? If I understand right you are saying that reference value is the value of percpetual signal (variable that is perceived)… The only perceived variable that I know in PCTT is perceptual signal. From when “perceptual signal” carries any “reference value” ??? Where you got that ???

Are you introducing Ricks’ “Controlled Perceptual Variable” or CPV ??? How can “perceptual signal” carry any information about “reference level” if it’s going to be determined in comparator when “mix” with reference signal will be made. See definition of “reference signal” above. “Reference signal” inside organism specifies (determine) reference level of the controlled quantity (perceptual signal). Bill didn’t mention that perceptual signal could “carry” any reference information and be compared to references in organism.

Well I’ve got headache. It’s enough phylosophy and nebouloses you wrote in rest of your post. Nobody wrote that “reference signals” can’t be perceived. You again invented a problem probably to feed your BNCT ego. Â

Boris

BN : The corresponding reference signal is a theoretical value that is built into a computer simulation of the observed behavior (=control of perceptual input). When the numerical inputs and outputs of the simulation very accurately replicate measured inputs and outputs of the modeled organism we infer from that the presence of a corresponding reference signal inside the organism.

You might also mean that reference signals are not perceived by one who is observing the behavior of an organism. With few exceptions so far, and then only at lower levels of the hierarchy, reference signals are not observable in vivo in neurons and/or intracellular chemicals forming the interior parts of a control loop in an organism as it controls inputs via that loop. (Henry will surely know the latest, and may very well correct me here.) Reference values are perceived empirical measurements; reference signals are inferred theoretical quantities.

Another way to put this statement (that reference signals are not perceived by the organism that generates them) is to say that efferrent (outbound) reference signals do not enter the stream of afferent (inbound) perceptual signals But that is exactly what happens in Bill’s ‘imagination mode’ hypothesis, where a reference signal constructed from a plurality of higher-level error signals is fed back to the afferent perceptual input. To say that the reference signal is not perceived in that case, because by being shunted over it has become the perceptual signal, is a mere definitional nicety. SFAIK Bill’s ‘imagination mode’ hypothesis has never been demonstrated in neurophysiology–again, Henry may very well correct me here.

/Bruce

On Sun, Nov 25, 2018 at 2:42 AM “Boris Hartman” csgnet@lists.illinois.edu wrote:

Rick,

RM: Anyway, I found this kind of an encouraging start to building a model of pronunciation drift that could account for all the data in the Lubov article and make predictions about what what kind of data to collect or look for to further test the model. Comments and suggestions are welcome (I’m NOT looking at you, Boris;-)

RM: Now back to football and turkey.

HB : No kidding :blush:. As I see the situation it seems that you are getting to where Bruce Nevin wants you to go. You’ll probably get the conclussion that in avarage people in vicinity pronunce in the same way. So the conclussion will probably be that Bruce Nevins’ theory is right. The transmission in pronauciation is done with “perception of reference values”. You know what Bill thought about “statistical analysis”. And in PCT we know that “reference values” can’t be perceived.

Otherwise I’m used to your “insults” as you became used on mine :blush:. We understand each other quite well but it seems that others don’t understand. It seems that “reference values” can’t be transfered into niether of us. Not mentioning others. I can’t see anywhere any “transmission of reference values” from anybody to no one. Do you see them ?

It’s interesting with what PCT means I’ve tried to persuade you that Bills’ diagram and definitions of PCT control loop (“reference values”) are right and you simply didn’t adopt them (accept them through perception). It’s obvious that you are sticking to your internally produced and maintained “reference values” for how organisms function, which you created through your experiences (control loop) in your life forming your unique “reference values” in accordance to your organisms functioning.

Transfering “reference values” from me to you or from Martin to you simply doesn’t work. You are not learning in the sense Bruce Nevin wanted to present as you didn’t set any “internal reference” on the basis of “perceived reference values” from me or Martin. You even wrote articles based on your own references, although you probably knew that is risky. You have contiunued with your own theory (RCT) for years or better decades, because with own references which you are producing you guarantee perceptual stability. With “adopting” PCT or BNCT “reference values” you would probably lose stable “control” which is produced through your original references for organism’s “stability”. Only you know when you are controlling succesfully so why would you “adopt” any other “reference values”? You’ll probably “test” other possibilities when you’ll feel not succesfull in your actual perceptual control.

Anyway In your case BNCT theory of learning failed.

This time I’ll let you develope your theory without interfere unless you’ll start again with RCT :wink:.

Boris

From: Richard Marken (rsmarken@gmail.com via csgnet Mailing List) csgnet@lists.illinois.edu
Sent: Thursday, November 22, 2018 8:27 PM
To: csgnet csgnet@lists.illinois.edu
Cc: Richard Marken rsmarken@gmail.com
Subject: Model of “Collective Control” of Pronunciation Drift

[Rick Marken 2018-11-22_11:24:30]

RM: Happy Thanksgiving All.

RM: I’ve got a few hours before the Thanksgiving dinner so I thought I would tell you about a little control model I’ve written (in Excel) to provide a start at explaining the phenomena of pronunciation drift described in the Labov article posted by Burce N. My model was very simple – 10 people in two different, non-interacting populations – Up and Down Islanders. Each person in each population starts with a slightly different way of pronouncing /au/ in terms of centralization index (CI) but the average CI value in the two populations starts out the same.

Each person in each population is controlling for pronouncing /au/ in the same way as the person they are currently closest to. The proximity between all the members of the population is constantly varying so everyone is controlling for pronouncing in a way that is consistent with the pronunciation of a different person at different times.

Here is the result of one run of the model, showing the variation in average CI over time in the two populations:

Picture1.png

On this run the Up Islanders converge to a CI average close to .66 and the Down Islanders converge to a CI average close to .33, which are the actual values found by Labov, as shown in the table below.

image.png

RM: But this is not always the result. Sometimes the Down Islanders end up with the high CI value, as shown here:

Picture2.png

RM: So going just on proximity alone, the model predicts that the two populations could have converged at different pronunciations of /au/. But what’s most interesting about the model is that it does show that people who are just controlling for pronouncing like the people around them, all of whom initially pronounce things slightly differently, will converge to pronouncing these things about the same.

RM: Anyway, I found this kind of an encouraging start to building a model of pronunciation drift that could account for all the data in the Lubov article and make predictions about what what kind of data to collect or look for to further test the model. Comments and suggestions are welcome (I’m NOT looking at you, Boris;-)

RM: Now back to football and turkey.

Best

Rick

Richard S. Marken

"Perfection is achieved not when you have nothing more to add, but when you
have nothing left to take away.�
–Antoine de Saint-Exupery

[Bruce Nevin 2018-11-28_16:15:08 UTC]

Rick Marken 2018-11-25_13:58:50 –

Thanks much.Â

Omitted is what governs proximity. Unlike CROWD, movements and therefore pairwise proximities are random within each population, I assume.

Bruce Nevin 2018-11-24_20:03:40 UTC –

BN: You haven’t indicated how many approaches occur during a run that are close enough to trip this convergence of references.

RM: The convergence of the lower level references for pronouncing /au/ (a convergence that is implicit rather than explicit in this single level model) occurs via control for 0 difference between self and other pronunciation of /au/. This convergence is, thus, constantly occurring. What varies during a run is the distance between each individual and every other individual.

I mean convergence of the population as a whole. This is of course the cumulative result of successive convergences between pairs of agents (or sometimes more than two come close enough together, I suppose), which is what you understandably took me to mean. Putting my question another way, if the change in question occurred over a period of 50 years, how many conversations will have occurred between members of the population during that time? I am supposing that the number of effective approaches in a run of the model is a tiny fraction of that number. This may be because the effect is not as strong (individuals resist changing their references, or revert after nonce convergence during a conversation, etc.), because other factors oppose such change, or for other reasons. Observationally, older people are less amenable to such influence than younger people (e.g. after parallel experiences of going away to live in another community and coming back). Crucially for Labov’s findings, young people are forming an adult identity and dialect is a badge of identity. The biblical story of shibboleth is apt.

“Approaches” refers to what I assume in your model is agents coming into sufficient physical-coordinates proximity to effect influence. This models the conventional view in historical linguistics, namely, that convergence of pronunciation among members of a speech community is a function of frequency of intercommunication. Agents getting close is a proxy for people talking with each other. But Labov’s finding (replicated now many times and in diverse ways) was that “proximity” must be defined in multivariate terms, including various perceived aspects of personal, social, and group attributes. “Proximity” in the CROWD sense stands as a proxy for “the social motivations of sound change” (the title of Labov’s paper). His central demonstration is that the geographic partition into up-Island (au .33 vs. .66) and down-Island shown in the early table is incidental. The sharpest distinction is kind of like Brexit, young people staying or leaving, on p. 300 (the narrowest difference .40 vs. .90), with the highest indices (au 1.11 and 2.11, p. 298) for a fisherman father and his son who first went away to get a college degree, “tried city life and didn’t care for it” and then returned and set himself up in business in the Chilmark fishing world. Physical proximity does not account for that.

image542.png

···

/Bruce

On Sun, Nov 25, 2018 at 5:06 PM Richard Marken csgnet@lists.illinois.edu wrote:

[Rick Marken 2018-11-25_13:58:50]

[Bruce Nevin 2018-11-24_20:03:40 UTC]

Â

BN: Yes, this is much better. It’s a partial model of dialect divergence. Partial: as you say, among the conditions for emulation it includes only proximity. And it is unclear what is being controlled.

RM: In the model, what is being controlled is the difference between a person’s own pronunciation, call it pSelfCI, and the pronunciation of the currently closest other person, call it pOtherCI. So the controlled variable for each individual is pSelfCI-pOtherCI. The model equations for each individual are as follows:Â

System (person) equation:Â

Output (t) = Output(t-tau)Â + slow * (gain* (r - (pSelfCI(t) - pOtherCI(t))-Output (t-tau)Â Â Â Â Â (1)

Environment equation:

pSelfCI(t) = pSelfCI (t-tau) +Output(t) + d                                     (2)

The Output variable corresponds to changes in the configuration of the vocal tract that bring the perception of your pronunciation of /au/ to match that of the other person you are close to (and presumably talking to). The reference for the controlled perception, r, is 0 so the actual computer code for the system equation is:

Output (t) = Output(t-tau)Â + slow * (gain* (- (pSelfCI(t) - pOtherCI(t))-Output (t-tau)Â Â

RM: The values of slow and gain are the same for all individuals and selected to produce stable control. And d represents random disturbances to your own pronunciation of /au/, such as slight variations in the shape of the vocal tract like dryness and the amount of food in the mouth.

RM: So equations (1) and (2) are the model of each individual. Each individual is controlling the difference between how they and the person currently nearest to them pronounce /au/ in terms of CI index, and they are controlling for this difference being 0.Â

Â

BN: It sounds like cause-effect: proximity to another causes convergence of an ‘internal’ value (more like an attribute) toward that of the other.

RM: That’s why modeling is so important. A verbal description of the model may sound like cause and effect but with the model you can point to the equations and show that there is actually a closed loop of cause and effect which results in control of the difference between one’s own and the closest other person’s pronunciation of a diphthong.

Â

BN: You haven’t indicated how many approaches occur during a run that are close enough to trip this convergence of references.

RM: The convergence of the lower level references for pronouncing /au/ (a convergence that is implicit rather than explicit in this single level model) occurs via control for 0 difference between self and other pronunciation of /au/. This convergence is, thus, constantly occurring. What varies during a run is the distance between each individual and every other individual.

Â

BN: Observationally, change within a speech community is rather slow, typically requiring decades in stable social conditions. Are there enough ‘contacts’ for any given agent during a run to correlate with the number of speech interactions over a decade or so? A preference for approximating one kind of exemplary person and/or distancing oneself from the other kind of exemplar would have a slowing effect on the convergence.Â

RM: These are things that should be handled by extensions of the model, if the relevant data exists to know how it should be extended. Right now, all the model does is show that different groups, each containing people who are controlling for pronouncing a diphthong the way others in their group pronounce it, will converge to different, consistent ways of pronouncing the diphthong. In other words, it accounts for the data in Labov’s Table 3.Â

BN: Stepping back to naturalistic observation to speculate about potential variables…

RM: Interesting observations.Â

Â

BN: I expect that a number of potentially controlled perceptions can be identified for testing or for indirect verification wrt documented observations. A fundamental reference is Milton Mazer’s People and predicaments: Of life and distress on Martha’s Vineyard, HUP 1976, dealing very closely with the time period of Labov’s observations.

RM: Great. That could be useful, indeed.Â

RM: This is really interesting stuff and I would really like to keep working on it. But I’ve got other priorities at the moment but I could elevate the priority of this work if I could get a linguist or sociologist to work on it with me.  Â

BN: Well, you’ve got one linguist here.

RM: Super.

BestÂ

Rick

Â

d Marken csgnet@lists.illinois.edu wrote:

[Rick Marken 2018-11-24_10:14:44]

RM: Thanks for all the nice comments. But it turns out that the model results are plotted were based on a faulty model. My mistake was small by crucial: I basically got the error calculation in the model wrong so that the result was a positive feedback loop which I had limited by limiting the perceptual input to be no greater than the limits found in the data. I discovered this error while trying to think of how to get the model to converge to CI averages other than .66 and .33.Â

RM: When I fixed the model, things went even better than they had with the original, incorrect model. Here’s the results of one run:

image.png

RM: The reason this result is better is that the model converges (by chance) to different CI values on each run. The graph above shows only on result; the model converges to quite different values for the Up and Down Islanders on each run. This is a feature, not a bug, because it can account for the differences in CI averages for the subgroups in the Up and Down Island groups, as in this table:

Â

RM: Anyway, there is much more to do with the model. The main thing being to see if control for matching pronunciation based on variables besides proximity alone – such as the prestige of the speaker – would get the model to the different observed difference in average CI.Â

RM: This is really interesting stuff and I would really like to keep working on it. But I’ve got other priorities at the moment but I could elevate the priority of this work if I could get a linguist or sociologist to work on it with me.Â

BestÂ

Rick


Richard S. MarkenÂ

"Perfection is achieved not when you have nothing more to add, but when you
have nothing left to take away.�
                --Antoine de Saint-Exupery


Richard S. MarkenÂ

"Perfection is achieved not when you have nothing more to add, but when you
have nothing left to take away.�
                --Antoine de Saint-Exupery

 [Rick Marken 2018-11-29_15:18:10]

[Bruce Nevin 2018-11-28_16:15:08 UTC]

BN: Rick Marken 2018-11-25_13:58:50 –

BN: Thanks much.Â

RM: Thank you!Â

BN: Omitted is what governs proximity. Unlike CROWD, movements and therefore pairwise proximities are random within each population, I assume.

RM: Yes. My model uses a kludgy approach to moving individuals around; I have the people moving sinusoidally and computing their distance from each other in terms of how close each of their current sine wave values is to each other. Eventually I will have the people mill around quasi randomly in 2-D space and calculate proximity in terms of euclidean distance. But I think the current simple model correctly shows how the model works.Â

Â

RM: The convergence of the lower level references for pronouncing /au/ (a convergence that is implicit rather than explicit in this single level model) occurs via control for 0 difference between self and other pronunciation of /au/. This convergence is, thus, constantly occurring. What varies during a run is the distance between each individual and every other individual.

BN: I mean convergence of the population as a whole. This is of course the cumulative result of successive convergences between pairs of agents (or sometimes more than two come close enough together, I suppose), which is what you understandably took me to mean.

RM: Actually, the convergence of the population as a whole to a particular pronunciation is a side effect of the convergences of the pronunciations between pairs of agents that results from each agent controlling for pronouncing like the agent currently closest to it. And because the proximity of one individual to another in the population varies randomly the pronunciation average to which the population converges can be quite different for populations that start with the same average pronunciation. Here’s a couple of different runs of the model to show what I mean:

Â

image542.png

image548.png

RM: The graphs show the average pronunciation (in terms of CI) of populations (Groups) varying over time. Each Group is a separate population consisting of 10 interacting speakers. Each graph shows a simulation involving three Groups, all three of which start with the same average pronunciation. As you can see, over time the average pronunciation converges to a different stable (fairly constant) value – that stable value being a side effect of each individual controlling for 0 difference between it’s own pronunciation and that of the others in the populations. Notice in the top graph how each population, starting at the same average CI value, ends up stabilized at different average CI values. The same happens in the lower graph but I put it in to show that the CI average at which each population gets stabilized is different on each run.Â

RM: What this means is that, in order to get these proximity based pronunciation averages to correspond to the data, we will have to add something to the model that will make this happen. And I think this is where the data on the CI averages as a function of age and social variables will come in.

BN: Putting my question another way, if the change in question occurred over a period of 50 years, how many conversations will have occurred between members of the population during that time?

RM: That could be calculated from the model. But I don’t think it’s worth doing that since there is no data at hand that I know of against which the model results could be compared.

Â

BN: I am supposing that the number of effective approaches in a run of the model is a tiny fraction of that number.

RM: This implies that you have seen data on how many effective approaches per unit time it takes to reach a stable average pronunciation value. That’s great. We can use it to tune up the model even further.Â

Â

BN: “Approaches” refers to what I assume in your model is agents coming into sufficient physical-coordinates proximity to effect influence.

RM: Yes, where “sufficient proximity” means proximity to another person in the population to whom you are currently closest.

Â

BN: This models the conventional view in historical linguistics, namely, that convergence of pronunciation among members of a speech community is a function of frequency of intercommunication.

RM: Yes, indeed.Â

Â

BN: Agents getting close is a proxy for people talking with each other. But Labov’s finding (replicated now many times and in diverse ways) was that “proximity” must be defined in multivariate terms, including various perceived aspects of personal, social, and group attributes.

 RM: Yes, and, as I noted above, these variables will surely have to be added to the model in order to account for the fact that the different populations stabilize at different average pronunciation values.

BN: “Proximity” in the CROWD sense stands as a proxy for “the social motivations of sound change” (the title of Labov’s paper). His central demonstration is that the geographic partition into up-Island (au .33 vs. .66) and down-Island shown in the early table is incidental. The sharpest distinction is kind of like Brexit, young people staying or leaving, on p. 300 (the narrowest difference .40 vs. .90), with the highest indices (au 1.11 and 2.11, p. 298) for a fisherman father and his son who first went away to get a college degree, “tried city life and didn’t care for it” and then returned and set himself up in business in the Chilmark fishing world. Physical proximity does not account for that.

RM: I think proximity will have to be part of the deal; I can’t imagine that it is possible to build a plausible model of pronunciation change without having people talk to each other, which does not have to occur by physical proximity, of course, but people would have to at least be able to hear how other people pronounce things relative to themselves and change based on the difference. I think that the social and age variables that Labov talks about (and has data on) should be added to the model as variables that affect which of the people to which one is talking is a person to be imitated. I think the next step in this modeling exercise should be adding one of those social variables to show how this can affect the stable state to which the average pronunciation in a population converges. When I get a chance I’ll so that and let you know how it works. But in the meantime if you know of any other papers that have data relevant to pronunciation drift I’d like to see them.

BestÂ

Rick

image549.png

···

/Bruce

On Sun, Nov 25, 2018 at 5:06 PM Richard Marken csgnet@lists.illinois.edu wrote:

[Rick Marken 2018-11-25_13:58:50]

[Bruce Nevin 2018-11-24_20:03:40 UTC]

Â

BN: Yes, this is much better. It’s a partial model of dialect divergence. Partial: as you say, among the conditions for emulation it includes only proximity. And it is unclear what is being controlled.

RM: In the model, what is being controlled is the difference between a person’s own pronunciation, call it pSelfCI, and the pronunciation of the currently closest other person, call it pOtherCI. So the controlled variable for each individual is pSelfCI-pOtherCI. The model equations for each individual are as follows:Â

System (person) equation:Â

Output (t) = Output(t-tau)Â + slow * (gain* (r - (pSelfCI(t) - pOtherCI(t))-Output (t-tau)Â Â Â Â Â (1)

Environment equation:

pSelfCI(t) = pSelfCI (t-tau) +Output(t) + d                                     (2)

The Output variable corresponds to changes in the configuration of the vocal tract that bring the perception of your pronunciation of /au/ to match that of the other person you are close to (and presumably talking to). The reference for the controlled perception, r, is 0 so the actual computer code for the system equation is:

Output (t) = Output(t-tau)Â + slow * (gain* (- (pSelfCI(t) - pOtherCI(t))-Output (t-tau)Â Â

RM: The values of slow and gain are the same for all individuals and selected to produce stable control. And d represents random disturbances to your own pronunciation of /au/, such as slight variations in the shape of the vocal tract like dryness and the amount of food in the mouth.

RM: So equations (1) and (2) are the model of each individual. Each individual is controlling the difference between how they and the person currently nearest to them pronounce /au/ in terms of CI index, and they are controlling for this difference being 0.Â

Â

BN: It sounds like cause-effect: proximity to another causes convergence of an ‘internal’ value (more like an attribute) toward that of the other.

RM: That’s why modeling is so important. A verbal description of the model may sound like cause and effect but with the model you can point to the equations and show that there is actually a closed loop of cause and effect which results in control of the difference between one’s own and the closest other person’s pronunciation of a diphthong.

Â

BN: You haven’t indicated how many approaches occur during a run that are close enough to trip this convergence of references.

RM: The convergence of the lower level references for pronouncing /au/ (a convergence that is implicit rather than explicit in this single level model) occurs via control for 0 difference between self and other pronunciation of /au/. This convergence is, thus, constantly occurring. What varies during a run is the distance between each individual and every other individual.

Â

BN: Observationally, change within a speech community is rather slow, typically requiring decades in stable social conditions. Are there enough ‘contacts’ for any given agent during a run to correlate with the number of speech interactions over a decade or so? A preference for approximating one kind of exemplary person and/or distancing oneself from the other kind of exemplar would have a slowing effect on the convergence.Â

RM: These are things that should be handled by extensions of the model, if the relevant data exists to know how it should be extended. Right now, all the model does is show that different groups, each containing people who are controlling for pronouncing a diphthong the way others in their group pronounce it, will converge to different, consistent ways of pronouncing the diphthong. In other words, it accounts for the data in Labov’s Table 3.Â

BN: Stepping back to naturalistic observation to speculate about potential variables…

RM: Interesting observations.Â

Â

BN: I expect that a number of potentially controlled perceptions can be identified for testing or for indirect verification wrt documented observations. A fundamental reference is Milton Mazer’s People and predicaments: Of life and distress on Martha’s Vineyard, HUP 1976, dealing very closely with the time period of Labov’s observations.

RM: Great. That could be useful, indeed.Â

RM: This is really interesting stuff and I would really like to keep working on it. But I’ve got other priorities at the moment but I could elevate the priority of this work if I could get a linguist or sociologist to work on it with me.  Â

BN: Well, you’ve got one linguist here.

RM: Super.

BestÂ

Rick

Â

d Marken csgnet@lists.illinois.edu wrote:

[Rick Marken 2018-11-24_10:14:44]

RM: Thanks for all the nice comments. But it turns out that the model results are plotted were based on a faulty model. My mistake was small by crucial: I basically got the error calculation in the model wrong so that the result was a positive feedback loop which I had limited by limiting the perceptual input to be no greater than the limits found in the data. I discovered this error while trying to think of how to get the model to converge to CI averages other than .66 and .33.Â

RM: When I fixed the model, things went even better than they had with the original, incorrect model. Here’s the results of one run:

image.png

RM: The reason this result is better is that the model converges (by chance) to different CI values on each run. The graph above shows only on result; the model converges to quite different values for the Up and Down Islanders on each run. This is a feature, not a bug, because it can account for the differences in CI averages for the subgroups in the Up and Down Island groups, as in this table:

Â

RM: Anyway, there is much more to do with the model. The main thing being to see if control for matching pronunciation based on variables besides proximity alone – such as the prestige of the speaker – would get the model to the different observed difference in average CI.Â

RM: This is really interesting stuff and I would really like to keep working on it. But I’ve got other priorities at the moment but I could elevate the priority of this work if I could get a linguist or sociologist to work on it with me.Â

BestÂ

Rick


Richard S. MarkenÂ

"Perfection is achieved not when you have nothing more to add, but when you
have nothing left to take away.�
                --Antoine de Saint-Exupery


Richard S. MarkenÂ

"Perfection is achieved not when you have nothing more to add, but when you
have nothing left to take away.�
                --Antoine de Saint-Exupery


Richard S. MarkenÂ

"Perfection is achieved not when you have nothing more to add, but when you
have nothing left to take away.�
                --Antoine de Saint-Exupery

[From Erling Jorgensen (2018.11.30 1410 EDT)]Â

EJ: In the System (person) equation, it looks like there should be two more closed-parentheses marks. I am forgetting how much of what follows ‘slow’ is multiplied by, and how much is ‘gain’ multiplied by. It seems there should be an extra parenthesis mark after ‘pOtherCI(t))’ and an extra one after ‘Output (t-tau)’. If so it would read:

Output (t) = Output(t-tau) + slow * (gain* (r - (pSelfCI(t) - pOtherCI(t)))-Output (t-tau)) (1)

EJ: Is that right? Or does the slowing factor just multiply the product that the gain factor just produced?Â

RM: No you’re right. The slowing factor is a proportion of the change in output produced by the multiplication of gain times error. I got it right in the computer code:Â

Output(i) = Output(i) + 0.5 * (0.8 * -(pSelfCI - pOtherCI) - Output(i))Â

where i is the index of the individual in the population for which the output is being calculated. The slowing and gain factors that are shown (.5 and .8) are the one’s that seemed to work best in the sense that they led to a stable outcome after a few trials. But other values in the range of those work pretty well also.Â

EJ: Along this line, what slowing factor are you using and what gain are you using in the current version of the model? Â

 RM: See above.Â

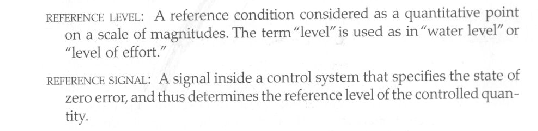
EJ:Â Just a word about how reference values are being affected here…

EJ: Typically, perceptions get adjusted to match reference levels. But how are reference levels established

 RM: In the model the reference is set by me. An extension of the model would be to add a level of control, such as a level that controls for imitating only high prestige members of the group, and have that level set the reference for the difference between self and other pronunciation to 0 if the other is prestigious and perhaps to some small number if the other person is not prestigious. Setting the reference to be not equal to 0 will cause the system to control for making the self CI differ from the other CI by a small amount.

EJ: The center of equation (1) has abbreviated terms of [… r - (pSelf - pOther) …], which becomes [… r - pSelf + pOther …] In other words, the observed pronunciation of the Other gets added to the reference, ‘before’ one’s own pronunciation is subtracted. And with each person’s reference initialized to 0, that means the other person’s pronunciation becomes the de facto reference value for each person’s drifting perceptual control.Â

 RM: That is a brilliant observation. I could have written my computer equation as follows:Â

Output(i) = Output(i) + 0.5 * (0.8 * (pOtherCI - pSelfCI) - Output(i))Â Â Â

RM: And it would behave exactly the same! And it could be interpreted as the other person’s pronunciation, pOtherCI, being the reference specification for one’s own pronunciation, pSelfCI. And this is precisely the way non-PCT applications of control theory to behavior have modeled behavior; the error that drives “behavior” (output) was seen as being in the environment, where the causes of behavior are though to be by conventional psychologists. And this way of applying control theory (which involves all kinds of impressive math, such as some members of this group find to be evidence of understanding a theory) “works” in the sense that it accounts for data in situations where the controller is not varying their reference for the perception being controlled.Â

RM: What Powers did was point out that reference specifications perceptual states of affairs are inside the controller, not out in the world. Nothing outside of the individuals on Martha’s Vineyard who were controlling for matching their pronunciation to that of another person told them to keep the difference between pOtherCl and pSelfCI equal to 0. The difference between pOtherCl and pSelfCI – pSelfCI - pOtherCl – is a perception that is being kept equal to a reference of 0 that is inside the person. It’s easy to demonstrate that this is the case by simply changing from controlling for imitating the way another person pronounces something to controlling for pronouncing it as differently as possible. Â

RM: So rather than writing the error calculation in my model as (pOtherCI-pSelfCI)Â I write it as r- (pSelfCI -Â pOtherCI) to make it clear that error is r-p and that the controlled p is the difference between self and other pronunciation in terms of CI, pSelfCI- pOtherCI.Â

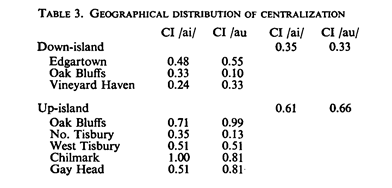
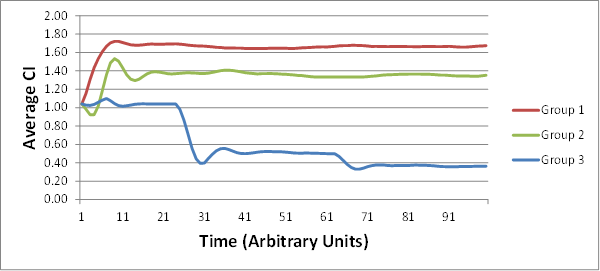
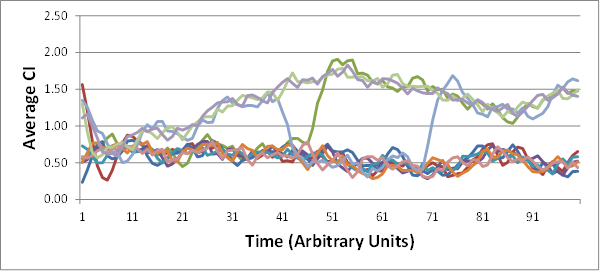
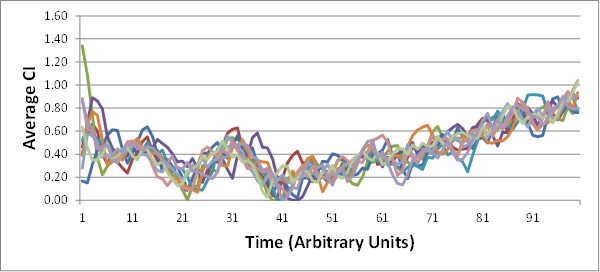
EJ: I assume that the initial values of (pSelfCI) are assigned randomly, seemingly with Centralization Index values varying between .00 and 2.00. Is that correct?Â

RM: Yes, exactly! Though, in order to start all three groups with the same average CI, I use the same 10 randomly selected CI values as the starting CI values for each group.Â

EJ: With the only constraint being that each Group starts with the same AverageCI among its 10Â members as the other two Groups.Â

RM: Yes, see above. Â

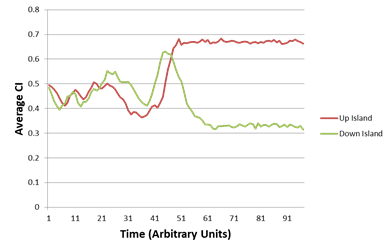
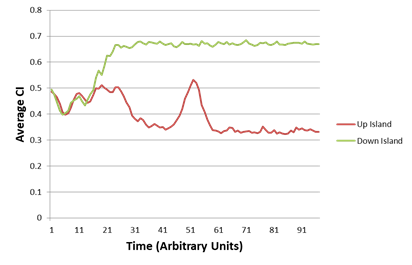
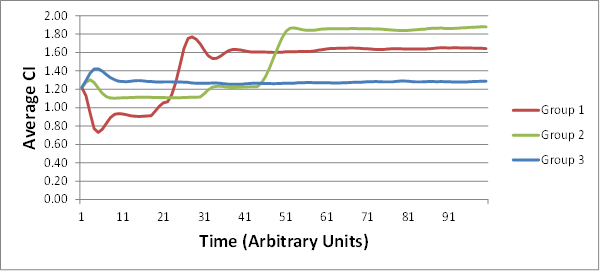
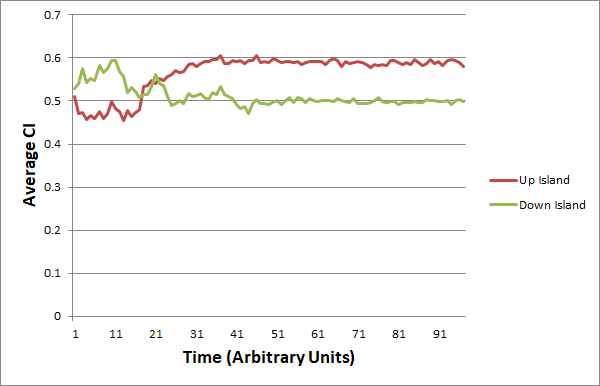
EJ:Â That’s the part that’s so striking about the representative graphs that you provide in –

EJ:Â I am stunned that each group’s AverageCI migrates to a new fairly stable value that is different from the other groups!Â

RM: Yes, I agree. It was pretty exciting to see it work that way!Â

Â

EJ: And all of that as a side effect of iterative interactions between fluctuating dyads within each (geographic) group.

RM: Yes, indeed. Â

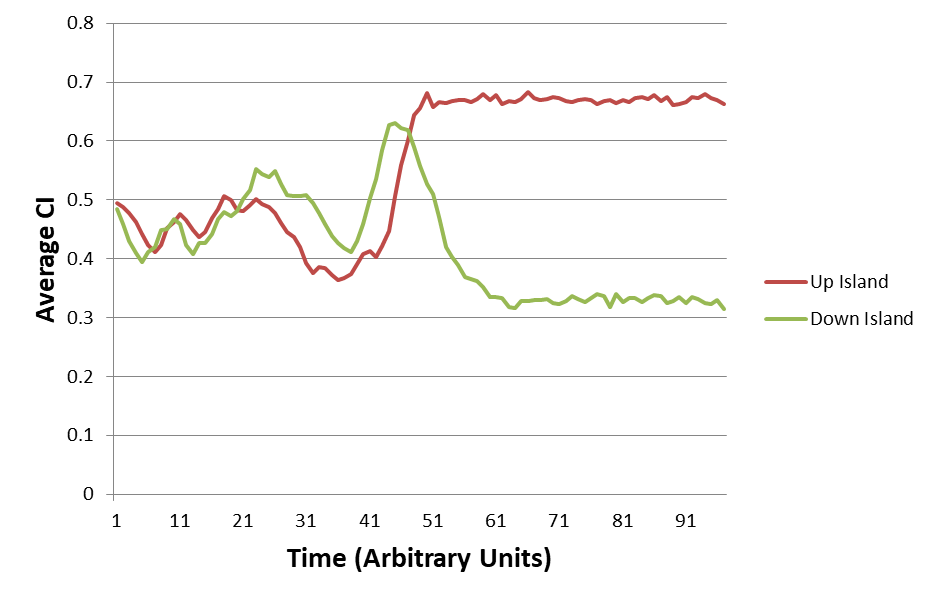
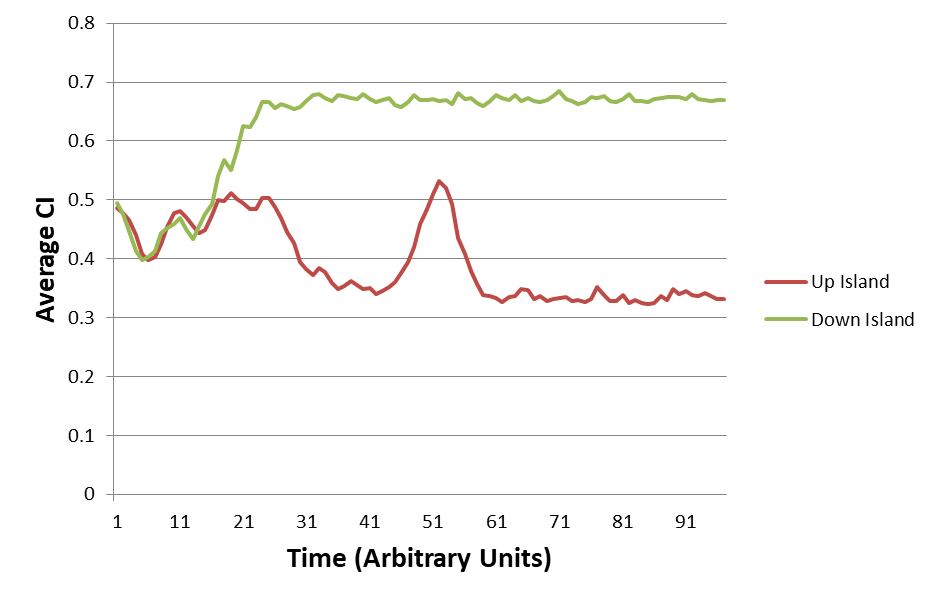
EJ:Â I know you graph the changes over time as "arbitrary units."Â But can you give us some idea of the number of iterations?Â

RM: Actually, the numbers are the iterations of the program. Â

EJ: Is it really the case that it only takes from 10 to 20 rounds of random interactions (among 10 members of a given group) for some of the groups to converge onto a stable AverageCI? That’s pretty amazing.Â

RM: Yes, it usually takes from 10 to 20 iterations to reach stability, though you can make it take more iterations by using a smaller slowing factor. But reduce the slowing too much and the individuals don’t control very well and the average CI doesn’t ever reach stability. The observed average stability occurs only when the individuals have good control of their perception, pSelfCI- pOtherCI.Â

RM: But these results look so good that I do want to be sure that there is no mistake in the coding that produces them. So I will keep checking it out as I go. But I am also attaching the spreadsheet that runs the model so you can run it and see what happens. If you know Visual Basic you can open up the program in the “Run” button and possibly get some idea of how it works, though I’m not particularly good at documenting my programs. Since the spreadsheet contains a program macro it will give you a warning when you open it but don’t worry, there are no viruses in it. I just hope the email let’s it through. IF it doesn’t you can get it from DropBox:

https://www.dropbox.com/s/54tlwgmjin2pl0v/CI%20Control%20Basic%20Model.xlsm?dl=0

Â

EJ:Â I really appreciate you and Bruce N. doing this joint hypothesizing and model building ‘out loud,’ so to speak, so the rest of us can listen in and see how a proposed PCT model might be applied to a given set of data.Â

RM: Thanks. And I agree, this could be a great way to learn how to do PCT research using archival data and computer modeling. And the computer modeling itself is a great way to learn PCT. Â

Â

EJ: It is impressive that stable group data can emerge as side effects of individual control system interactions.Â

RM: Ain’t it though!! I thought it might work but I had no idea that it would work so well. But there is still the problem of figuring out whether we can get average CI to a particular destination based on age and social aspects of the “others” with whom each person is speaking.

EJ: (Which, by the way, is exactly one of the take-away lessons of the CROWD simulations.) I especially like how the model is built up, one approximation at a time, to see how much of the phenomena can be handled by a relatively simple model, before adding further refinements. Nice job, Rick.Â

RM: I agree about the lessons of CROWD and building the model one step at a time. I’m really glad you like it! This is what I always hoped the CSGNet would be used for – collaboration rather than confrontation.

Best regards

Rick

CI Control Basic Model.xlsm (101 KB)

···


Richard S. MarkenÂ

"Perfection is achieved not when you have nothing more to add, but when you
have nothing left to take away.�
                --Antoine de Saint-Exupery

[Bruce Nevin 2018-12-01_19:39:53 UTC]

Rick Marken 2018-11-29_15:18:10 –

BN: Yes, we’re in agreement both as to what you’ve achieved and as to what comes next.

RM: if you know of any other papers that have data relevant to pronunciation drift I’d like to see them.

BN: I’ll get some to you.

BN: The graphs show the average CI in three populations. In each population differently, the average CI changes for a period of time and then stabilizes. The length of time during which the average CI varies can be quite short or (in these six example lines) as long as about 75% of the run.

BN: I believe you have said that the average CI settles down as the individual CI values converge toward a common value, in other words, they are two aspects of the same process, but it would take a different display to show the individual values converging in a given population concurrently as the average beomes stable.

BN: how many conversations will have occurred between members of the population during [a 50-year span]?] I am supposing that the number of effective approaches in a run of the model is a tiny fraction of that number.

RM: This implies that you have seen data on how many effective approaches per unit time it takes to reach a stable average pronunciation value. That’s great. We can use it to tune up the model even further.Â

BN: No, the only data I know of about frequency of conversations are chat metrics, where computers can keep count because they are the ‘speech organs’.  I am only supposing that the number of ‘effective approaches’ between agents in the model is a much smaller number than the great many conversations that I estimate that people in a community have during 50 years. How would one approach estimating how many conversations occur in a community during 50 years? In the course of a day, how many times does an individual converse with someone? That’s going to vary from one individual to another over a very wide range (extravert/introvert, retail salesperson in a busy store vs. farmer on a tractor all day), and from one day to another, perhaps between 5 and 200 (setting aside vows of silence and solitary introverts). 50 years is 18,262 days; times 5 per day is 91,312 conversations, and times 200 per day is 3,652,500 conversations. I don’t know how many times a given agent in the program approaches another closely enough to be affected, but what I was supposing was that whatever that number is it is smaller than 3 million and probably smaller than 100 thousand, but of course I don’t know.

Other controlled variables influence how ‘effective’ a given ‘approach’ is. That’s for later.

Rabbit Hole Department: For another perspective, I just looked for some data on how long it takes a newly deaf person’s speech to ‘drift’ from the person’s previous reference values. Not surprisingly, I couldn’t find anything–for some reason, other people don’t think about things in the perfectly reasonable ways that we do. But I did find this interesting experiment in which deaf speakers resist a mild disturbance to jaw position which hearing speakers do not resist.Â

https://www.nature.com/articles/nn.2193

I got there from https://www.newscientist.com/article/mg19926745-500-deaf-people-feel-the-correct-pronunciation/

image549.png

image542.png

image548.png

···

/Bruce

On Thu, Nov 29, 2018 at 7:29 PM Richard Marken csgnet@lists.illinois.edu wrote:

 [Rick Marken 2018-11-29_15:18:10]

[Bruce Nevin 2018-11-28_16:15:08 UTC]

BN: Rick Marken 2018-11-25_13:58:50 –

BN: Thanks much.Â

RM: Thank you!Â

BN: Omitted is what governs proximity. Unlike CROWD, movements and therefore pairwise proximities are random within each population, I assume.

RM: Yes. My model uses a kludgy approach to moving individuals around; I have the people moving sinusoidally and computing their distance from each other in terms of how close each of their current sine wave values is to each other. Eventually I will have the people mill around quasi randomly in 2-D space and calculate proximity in terms of euclidean distance. But I think the current simple model correctly shows how the model works.Â

Â

RM: The convergence of the lower level references for pronouncing /au/ (a convergence that is implicit rather than explicit in this single level model) occurs via control for 0 difference between self and other pronunciation of /au/. This convergence is, thus, constantly occurring. What varies during a run is the distance between each individual and every other individual.

BN: I mean convergence of the population as a whole. This is of course the cumulative result of successive convergences between pairs of agents (or sometimes more than two come close enough together, I suppose), which is what you understandably took me to mean.

RM: Actually, the convergence of the population as a whole to a particular pronunciation is a side effect of the convergences of the pronunciations between pairs of agents that results from each agent controlling for pronouncing like the agent currently closest to it. And because the proximity of one individual to another in the population varies randomly the pronunciation average to which the population converges can be quite different for populations that start with the same average pronunciation. Here’s a couple of different runs of the model to show what I mean:

Â

image.png

image.png

RM: The graphs show the average pronunciation (in terms of CI) of populations (Groups) varying over time. Each Group is a separate population consisting of 10 interacting speakers. Each graph shows a simulation involving three Groups, all three of which start with the same average pronunciation. As you can see, over time the average pronunciation converges to a different stable (fairly constant) value – that stable value being a side effect of each individual controlling for 0 difference between it’s own pronunciation and that of the others in the populations. Notice in the top graph how each population, starting at the same average CI value, ends up stabilized at different average CI values. The same happens in the lower graph but I put it in to show that the CI average at which each population gets stabilized is different on each run.Â

RM: What this means is that, in order to get these proximity based pronunciation averages to correspond to the data, we will have to add something to the model that will make this happen. And I think this is where the data on the CI averages as a function of age and social variables will come in.

BN: Putting my question another way, if the change in question occurred over a period of 50 years, how many conversations will have occurred between members of the population during that time?

RM: That could be calculated from the model. But I don’t think it’s worth doing that since there is no data at hand that I know of against which the model results could be compared.

Â

BN: I am supposing that the number of effective approaches in a run of the model is a tiny fraction of that number.

RM: This implies that you have seen data on how many effective approaches per unit time it takes to reach a stable average pronunciation value. That’s great. We can use it to tune up the model even further.Â

Â

BN: “Approaches” refers to what I assume in your model is agents coming into sufficient physical-coordinates proximity to effect influence.

RM: Yes, where “sufficient proximity” means proximity to another person in the population to whom you are currently closest.

Â

BN: This models the conventional view in historical linguistics, namely, that convergence of pronunciation among members of a speech community is a function of frequency of intercommunication.

RM: Yes, indeed.Â

Â

BN: Agents getting close is a proxy for people talking with each other. But Labov’s finding (replicated now many times and in diverse ways) was that “proximity” must be defined in multivariate terms, including various perceived aspects of personal, social, and group attributes.

 RM: Yes, and, as I noted above, these variables will surely have to be added to the model in order to account for the fact that the different populations stabilize at different average pronunciation values.

BN: “Proximity” in the CROWD sense stands as a proxy for “the social motivations of sound change” (the title of Labov’s paper). His central demonstration is that the geographic partition into up-Island (au .33 vs. .66) and down-Island shown in the early table is incidental. The sharpest distinction is kind of like Brexit, young people staying or leaving, on p. 300 (the narrowest difference .40 vs. .90), with the highest indices (au 1.11 and 2.11, p. 298) for a fisherman father and his son who first went away to get a college degree, “tried city life and didn’t care for it” and then returned and set himself up in business in the Chilmark fishing world. Physical proximity does not account for that.

RM: I think proximity will have to be part of the deal; I can’t imagine that it is possible to build a plausible model of pronunciation change without having people talk to each other, which does not have to occur by physical proximity, of course, but people would have to at least be able to hear how other people pronounce things relative to themselves and change based on the difference. I think that the social and age variables that Labov talks about (and has data on) should be added to the model as variables that affect which of the people to which one is talking is a person to be imitated. I think the next step in this modeling exercise should be adding one of those social variables to show how this can affect the stable state to which the average pronunciation in a population converges. When I get a chance I’ll so that and let you know how it works. But in the meantime if you know of any other papers that have data relevant to pronunciation drift I’d like to see them.

BestÂ

Rick

/Bruce

On Sun, Nov 25, 2018 at 5:06 PM Richard Marken csgnet@lists.illinois.edu wrote:

[Rick Marken 2018-11-25_13:58:50]

[Bruce Nevin 2018-11-24_20:03:40 UTC]

Â

BN: Yes, this is much better. It’s a partial model of dialect divergence. Partial: as you say, among the conditions for emulation it includes only proximity. And it is unclear what is being controlled.

RM: In the model, what is being controlled is the difference between a person’s own pronunciation, call it pSelfCI, and the pronunciation of the currently closest other person, call it pOtherCI. So the controlled variable for each individual is pSelfCI-pOtherCI. The model equations for each individual are as follows:Â

System (person) equation:Â

Output (t) = Output(t-tau)Â + slow * (gain* (r - (pSelfCI(t) - pOtherCI(t))-Output (t-tau)Â Â Â Â Â (1)

Environment equation:

pSelfCI(t) = pSelfCI (t-tau) +Output(t) + d                                     (2)

The Output variable corresponds to changes in the configuration of the vocal tract that bring the perception of your pronunciation of /au/ to match that of the other person you are close to (and presumably talking to). The reference for the controlled perception, r, is 0 so the actual computer code for the system equation is:

Output (t) = Output(t-tau)Â + slow * (gain* (- (pSelfCI(t) - pOtherCI(t))-Output (t-tau)Â Â

RM: The values of slow and gain are the same for all individuals and selected to produce stable control. And d represents random disturbances to your own pronunciation of /au/, such as slight variations in the shape of the vocal tract like dryness and the amount of food in the mouth.

RM: So equations (1) and (2) are the model of each individual. Each individual is controlling the difference between how they and the person currently nearest to them pronounce /au/ in terms of CI index, and they are controlling for this difference being 0.Â

Â

BN: It sounds like cause-effect: proximity to another causes convergence of an ‘internal’ value (more like an attribute) toward that of the other.

RM: That’s why modeling is so important. A verbal description of the model may sound like cause and effect but with the model you can point to the equations and show that there is actually a closed loop of cause and effect which results in control of the difference between one’s own and the closest other person’s pronunciation of a diphthong.

Â

BN: You haven’t indicated how many approaches occur during a run that are close enough to trip this convergence of references.

RM: The convergence of the lower level references for pronouncing /au/ (a convergence that is implicit rather than explicit in this single level model) occurs via control for 0 difference between self and other pronunciation of /au/. This convergence is, thus, constantly occurring. What varies during a run is the distance between each individual and every other individual.

Â

BN: Observationally, change within a speech community is rather slow, typically requiring decades in stable social conditions. Are there enough ‘contacts’ for any given agent during a run to correlate with the number of speech interactions over a decade or so? A preference for approximating one kind of exemplary person and/or distancing oneself from the other kind of exemplar would have a slowing effect on the convergence.Â

RM: These are things that should be handled by extensions of the model, if the relevant data exists to know how it should be extended. Right now, all the model does is show that different groups, each containing people who are controlling for pronouncing a diphthong the way others in their group pronounce it, will converge to different, consistent ways of pronouncing the diphthong. In other words, it accounts for the data in Labov’s Table 3.Â

BN: Stepping back to naturalistic observation to speculate about potential variables…

RM: Interesting observations.Â

Â

BN: I expect that a number of potentially controlled perceptions can be identified for testing or for indirect verification wrt documented observations. A fundamental reference is Milton Mazer’s People and predicaments: Of life and distress on Martha’s Vineyard, HUP 1976, dealing very closely with the time period of Labov’s observations.

RM: Great. That could be useful, indeed.Â

RM: This is really interesting stuff and I would really like to keep working on it. But I’ve got other priorities at the moment but I could elevate the priority of this work if I could get a linguist or sociologist to work on it with me.  Â

BN: Well, you’ve got one linguist here.

RM: Super.

BestÂ

Rick

Â

d Marken csgnet@lists.illinois.edu wrote:

[Rick Marken 2018-11-24_10:14:44]

RM: Thanks for all the nice comments. But it turns out that the model results are plotted were based on a faulty model. My mistake was small by crucial: I basically got the error calculation in the model wrong so that the result was a positive feedback loop which I had limited by limiting the perceptual input to be no greater than the limits found in the data. I discovered this error while trying to think of how to get the model to converge to CI averages other than .66 and .33.Â

RM: When I fixed the model, things went even better than they had with the original, incorrect model. Here’s the results of one run:

image.png

RM: The reason this result is better is that the model converges (by chance) to different CI values on each run. The graph above shows only on result; the model converges to quite different values for the Up and Down Islanders on each run. This is a feature, not a bug, because it can account for the differences in CI averages for the subgroups in the Up and Down Island groups, as in this table:

Â

RM: Anyway, there is much more to do with the model. The main thing being to see if control for matching pronunciation based on variables besides proximity alone – such as the prestige of the speaker – would get the model to the different observed difference in average CI.Â

RM: This is really interesting stuff and I would really like to keep working on it. But I’ve got other priorities at the moment but I could elevate the priority of this work if I could get a linguist or sociologist to work on it with me.Â

BestÂ

Rick


Richard S. MarkenÂ

"Perfection is achieved not when you have nothing more to add, but when you
have nothing left to take away.�
                --Antoine de Saint-Exupery


Richard S. MarkenÂ

"Perfection is achieved not when you have nothing more to add, but when you
have nothing left to take away.�
                --Antoine de Saint-Exupery


Richard S. MarkenÂ

"Perfection is achieved not when you have nothing more to add, but when you
have nothing left to take away.�
                --Antoine de Saint-Exupery

[Bruce Nevin 2018-12-01_19:54:41 UTC]

Forgot to say – I’m hoping we develop something worth a presentation or maybe a poster at LSA. The 2020 meeting is in New Orleans, then SF in 2021. Hence my interest in the relationship to parameters that linguists know about.

image548.png

image542.png

image549.png

···

/Bruce

On Thu, Nov 29, 2018 at 7:29 PM Richard Marken csgnet@lists.illinois.edu wrote:

 [Rick Marken 2018-11-29_15:18:10]

[Bruce Nevin 2018-11-28_16:15:08 UTC]

BN: Rick Marken 2018-11-25_13:58:50 –

BN: Thanks much.Â

RM: Thank you!Â

BN: Omitted is what governs proximity. Unlike CROWD, movements and therefore pairwise proximities are random within each population, I assume.

RM: Yes. My model uses a kludgy approach to moving individuals around; I have the people moving sinusoidally and computing their distance from each other in terms of how close each of their current sine wave values is to each other. Eventually I will have the people mill around quasi randomly in 2-D space and calculate proximity in terms of euclidean distance. But I think the current simple model correctly shows how the model works.Â

Â

RM: The convergence of the lower level references for pronouncing /au/ (a convergence that is implicit rather than explicit in this single level model) occurs via control for 0 difference between self and other pronunciation of /au/. This convergence is, thus, constantly occurring. What varies during a run is the distance between each individual and every other individual.

BN: I mean convergence of the population as a whole. This is of course the cumulative result of successive convergences between pairs of agents (or sometimes more than two come close enough together, I suppose), which is what you understandably took me to mean.

RM: Actually, the convergence of the population as a whole to a particular pronunciation is a side effect of the convergences of the pronunciations between pairs of agents that results from each agent controlling for pronouncing like the agent currently closest to it. And because the proximity of one individual to another in the population varies randomly the pronunciation average to which the population converges can be quite different for populations that start with the same average pronunciation. Here’s a couple of different runs of the model to show what I mean:

Â

image.png

image.png

RM: The graphs show the average pronunciation (in terms of CI) of populations (Groups) varying over time. Each Group is a separate population consisting of 10 interacting speakers. Each graph shows a simulation involving three Groups, all three of which start with the same average pronunciation. As you can see, over time the average pronunciation converges to a different stable (fairly constant) value – that stable value being a side effect of each individual controlling for 0 difference between it’s own pronunciation and that of the others in the populations. Notice in the top graph how each population, starting at the same average CI value, ends up stabilized at different average CI values. The same happens in the lower graph but I put it in to show that the CI average at which each population gets stabilized is different on each run.Â

RM: What this means is that, in order to get these proximity based pronunciation averages to correspond to the data, we will have to add something to the model that will make this happen. And I think this is where the data on the CI averages as a function of age and social variables will come in.

BN: Putting my question another way, if the change in question occurred over a period of 50 years, how many conversations will have occurred between members of the population during that time?

RM: That could be calculated from the model. But I don’t think it’s worth doing that since there is no data at hand that I know of against which the model results could be compared.

Â

BN: I am supposing that the number of effective approaches in a run of the model is a tiny fraction of that number.

RM: This implies that you have seen data on how many effective approaches per unit time it takes to reach a stable average pronunciation value. That’s great. We can use it to tune up the model even further.Â

Â

BN: “Approaches” refers to what I assume in your model is agents coming into sufficient physical-coordinates proximity to effect influence.

RM: Yes, where “sufficient proximity” means proximity to another person in the population to whom you are currently closest.

Â

BN: This models the conventional view in historical linguistics, namely, that convergence of pronunciation among members of a speech community is a function of frequency of intercommunication.

RM: Yes, indeed.Â

Â

BN: Agents getting close is a proxy for people talking with each other. But Labov’s finding (replicated now many times and in diverse ways) was that “proximity” must be defined in multivariate terms, including various perceived aspects of personal, social, and group attributes.

 RM: Yes, and, as I noted above, these variables will surely have to be added to the model in order to account for the fact that the different populations stabilize at different average pronunciation values.

BN: “Proximity” in the CROWD sense stands as a proxy for “the social motivations of sound change” (the title of Labov’s paper). His central demonstration is that the geographic partition into up-Island (au .33 vs. .66) and down-Island shown in the early table is incidental. The sharpest distinction is kind of like Brexit, young people staying or leaving, on p. 300 (the narrowest difference .40 vs. .90), with the highest indices (au 1.11 and 2.11, p. 298) for a fisherman father and his son who first went away to get a college degree, “tried city life and didn’t care for it” and then returned and set himself up in business in the Chilmark fishing world. Physical proximity does not account for that.

RM: I think proximity will have to be part of the deal; I can’t imagine that it is possible to build a plausible model of pronunciation change without having people talk to each other, which does not have to occur by physical proximity, of course, but people would have to at least be able to hear how other people pronounce things relative to themselves and change based on the difference. I think that the social and age variables that Labov talks about (and has data on) should be added to the model as variables that affect which of the people to which one is talking is a person to be imitated. I think the next step in this modeling exercise should be adding one of those social variables to show how this can affect the stable state to which the average pronunciation in a population converges. When I get a chance I’ll so that and let you know how it works. But in the meantime if you know of any other papers that have data relevant to pronunciation drift I’d like to see them.

BestÂ

Rick

/Bruce

On Sun, Nov 25, 2018 at 5:06 PM Richard Marken csgnet@lists.illinois.edu wrote:

[Rick Marken 2018-11-25_13:58:50]

[Bruce Nevin 2018-11-24_20:03:40 UTC]

Â

BN: Yes, this is much better. It’s a partial model of dialect divergence. Partial: as you say, among the conditions for emulation it includes only proximity. And it is unclear what is being controlled.

RM: In the model, what is being controlled is the difference between a person’s own pronunciation, call it pSelfCI, and the pronunciation of the currently closest other person, call it pOtherCI. So the controlled variable for each individual is pSelfCI-pOtherCI. The model equations for each individual are as follows:Â

System (person) equation:Â

Output (t) = Output(t-tau)Â + slow * (gain* (r - (pSelfCI(t) - pOtherCI(t))-Output (t-tau)Â Â Â Â Â (1)

Environment equation:

pSelfCI(t) = pSelfCI (t-tau) +Output(t) + d                                     (2)

The Output variable corresponds to changes in the configuration of the vocal tract that bring the perception of your pronunciation of /au/ to match that of the other person you are close to (and presumably talking to). The reference for the controlled perception, r, is 0 so the actual computer code for the system equation is:

Output (t) = Output(t-tau)Â + slow * (gain* (- (pSelfCI(t) - pOtherCI(t))-Output (t-tau)Â Â

RM: The values of slow and gain are the same for all individuals and selected to produce stable control. And d represents random disturbances to your own pronunciation of /au/, such as slight variations in the shape of the vocal tract like dryness and the amount of food in the mouth.

RM: So equations (1) and (2) are the model of each individual. Each individual is controlling the difference between how they and the person currently nearest to them pronounce /au/ in terms of CI index, and they are controlling for this difference being 0.Â

Â

BN: It sounds like cause-effect: proximity to another causes convergence of an ‘internal’ value (more like an attribute) toward that of the other.

RM: That’s why modeling is so important. A verbal description of the model may sound like cause and effect but with the model you can point to the equations and show that there is actually a closed loop of cause and effect which results in control of the difference between one’s own and the closest other person’s pronunciation of a diphthong.

Â

BN: You haven’t indicated how many approaches occur during a run that are close enough to trip this convergence of references.

RM: The convergence of the lower level references for pronouncing /au/ (a convergence that is implicit rather than explicit in this single level model) occurs via control for 0 difference between self and other pronunciation of /au/. This convergence is, thus, constantly occurring. What varies during a run is the distance between each individual and every other individual.

Â

BN: Observationally, change within a speech community is rather slow, typically requiring decades in stable social conditions. Are there enough ‘contacts’ for any given agent during a run to correlate with the number of speech interactions over a decade or so? A preference for approximating one kind of exemplary person and/or distancing oneself from the other kind of exemplar would have a slowing effect on the convergence.Â

RM: These are things that should be handled by extensions of the model, if the relevant data exists to know how it should be extended. Right now, all the model does is show that different groups, each containing people who are controlling for pronouncing a diphthong the way others in their group pronounce it, will converge to different, consistent ways of pronouncing the diphthong. In other words, it accounts for the data in Labov’s Table 3.Â

BN: Stepping back to naturalistic observation to speculate about potential variables…

RM: Interesting observations.Â

Â

BN: I expect that a number of potentially controlled perceptions can be identified for testing or for indirect verification wrt documented observations. A fundamental reference is Milton Mazer’s People and predicaments: Of life and distress on Martha’s Vineyard, HUP 1976, dealing very closely with the time period of Labov’s observations.

RM: Great. That could be useful, indeed.Â

RM: This is really interesting stuff and I would really like to keep working on it. But I’ve got other priorities at the moment but I could elevate the priority of this work if I could get a linguist or sociologist to work on it with me.  Â

BN: Well, you’ve got one linguist here.

RM: Super.

BestÂ

Rick

Â

d Marken csgnet@lists.illinois.edu wrote:

[Rick Marken 2018-11-24_10:14:44]

RM: Thanks for all the nice comments. But it turns out that the model results are plotted were based on a faulty model. My mistake was small by crucial: I basically got the error calculation in the model wrong so that the result was a positive feedback loop which I had limited by limiting the perceptual input to be no greater than the limits found in the data. I discovered this error while trying to think of how to get the model to converge to CI averages other than .66 and .33.Â

RM: When I fixed the model, things went even better than they had with the original, incorrect model. Here’s the results of one run:

image.png

RM: The reason this result is better is that the model converges (by chance) to different CI values on each run. The graph above shows only on result; the model converges to quite different values for the Up and Down Islanders on each run. This is a feature, not a bug, because it can account for the differences in CI averages for the subgroups in the Up and Down Island groups, as in this table:

Â

RM: Anyway, there is much more to do with the model. The main thing being to see if control for matching pronunciation based on variables besides proximity alone – such as the prestige of the speaker – would get the model to the different observed difference in average CI.Â

RM: This is really interesting stuff and I would really like to keep working on it. But I’ve got other priorities at the moment but I could elevate the priority of this work if I could get a linguist or sociologist to work on it with me.Â

BestÂ

Rick


Richard S. MarkenÂ

"Perfection is achieved not when you have nothing more to add, but when you
have nothing left to take away.�
                --Antoine de Saint-Exupery


Richard S. MarkenÂ

"Perfection is achieved not when you have nothing more to add, but when you
have nothing left to take away.�
                --Antoine de Saint-Exupery


Richard S. MarkenÂ

"Perfection is achieved not when you have nothing more to add, but when you
have nothing left to take away.�
                --Antoine de Saint-Exupery

[Rick Marken 2018-12-02_10:59:09]

[Bruce Nevin 2018-12-01_19:39:53 UTC]

RM: if you know of any other papers that have data relevant to pronunciation drift I’d like to see them.

BN: I’ll get some to you.

RM: Super!Â

BN: I believe you have said that the average CI settles down as the individual CI values converge toward a common value, in other words, they are two aspects of the same process, but it would take a different display to show the individual values converging in a given population concurrently as the average beomes stable.

 RM: Yes, I’ll work on that. It would be nice to see what the convergence within a population looks like over time. What I do know is that the variance of the CI values within the population decreases substantially over the course of the simulation.  That’s what stability is, after all; reduced variability. Unfortunately, Labov didn’t report the variance of the CI scores within the different populations that he observed so we don’t know if the model is converging too much or too little. Some evidence that this variance is considerable come from this table:

image548.png

RM: The average CI values for /ai/ are quite consistent across regions and age for all the fishermen. But the average CI values for /au/ are all over the map. Look, for example, at Chilmark, where the CI average range from .79 to 2.11, and those extremes come from fishermen living in the the same region who are nearly the same age. This kind of data is inconsistent with the model as it currently exists. But that’s fine; it shows how important data is!

RM: This implies that you have seen data on how many effective approaches per unit time it takes to reach a stable average pronunciation value. That’s great. We can use it to tune up the model even further.Â

BN: No, the only data I know of about frequency of conversations are chat metrics, where computers can keep count because they are the ‘speech organs’. Â

 RM: OK, I think we have other problems to solve before we get down to that level of detail!

BN: Rabbit Hole Department: For another perspective, I just looked for some data on how long it takes a newly deaf person’s speech to ‘drift’ from the person’s previous reference values. Not surprisingly, I couldn’t find anything–for some reason, other people don’t think about things in the perfectly reasonable ways that we do. But I did find this interesting experiment in which deaf speakers resist a mild disturbance to jaw position which hearing speakers do not resist.Â

https://www.nature.com/articles/nn.2193

 RM: What a great find! It doesn’t seem like they compared the results of the deaf with those for normal hearing people. Too bad but, still, it’s apparently a paper that I can use. Thanks!

BestÂ

Rick

image549.png

image542.png

image559.png

···

I got there from https://www.newscientist.com/article/mg19926745-500-deaf-people-feel-the-correct-pronunciation/

/Bruce

On Thu, Nov 29, 2018 at 7:29 PM Richard Marken csgnet@lists.illinois.edu wrote:

 [Rick Marken 2018-11-29_15:18:10]

[Bruce Nevin 2018-11-28_16:15:08 UTC]

BN: Rick Marken 2018-11-25_13:58:50 –

BN: Thanks much.Â

RM: Thank you!Â

BN: Omitted is what governs proximity. Unlike CROWD, movements and therefore pairwise proximities are random within each population, I assume.

RM: Yes. My model uses a kludgy approach to moving individuals around; I have the people moving sinusoidally and computing their distance from each other in terms of how close each of their current sine wave values is to each other. Eventually I will have the people mill around quasi randomly in 2-D space and calculate proximity in terms of euclidean distance. But I think the current simple model correctly shows how the model works.Â

Â

RM: The convergence of the lower level references for pronouncing /au/ (a convergence that is implicit rather than explicit in this single level model) occurs via control for 0 difference between self and other pronunciation of /au/. This convergence is, thus, constantly occurring. What varies during a run is the distance between each individual and every other individual.

BN: I mean convergence of the population as a whole. This is of course the cumulative result of successive convergences between pairs of agents (or sometimes more than two come close enough together, I suppose), which is what you understandably took me to mean.

RM: Actually, the convergence of the population as a whole to a particular pronunciation is a side effect of the convergences of the pronunciations between pairs of agents that results from each agent controlling for pronouncing like the agent currently closest to it. And because the proximity of one individual to another in the population varies randomly the pronunciation average to which the population converges can be quite different for populations that start with the same average pronunciation. Here’s a couple of different runs of the model to show what I mean:

Â

image.png

image.png

RM: The graphs show the average pronunciation (in terms of CI) of populations (Groups) varying over time. Each Group is a separate population consisting of 10 interacting speakers. Each graph shows a simulation involving three Groups, all three of which start with the same average pronunciation. As you can see, over time the average pronunciation converges to a different stable (fairly constant) value – that stable value being a side effect of each individual controlling for 0 difference between it’s own pronunciation and that of the others in the populations. Notice in the top graph how each population, starting at the same average CI value, ends up stabilized at different average CI values. The same happens in the lower graph but I put it in to show that the CI average at which each population gets stabilized is different on each run.Â

RM: What this means is that, in order to get these proximity based pronunciation averages to correspond to the data, we will have to add something to the model that will make this happen. And I think this is where the data on the CI averages as a function of age and social variables will come in.

BN: Putting my question another way, if the change in question occurred over a period of 50 years, how many conversations will have occurred between members of the population during that time?

RM: That could be calculated from the model. But I don’t think it’s worth doing that since there is no data at hand that I know of against which the model results could be compared.

Â

BN: I am supposing that the number of effective approaches in a run of the model is a tiny fraction of that number.

RM: This implies that you have seen data on how many effective approaches per unit time it takes to reach a stable average pronunciation value. That’s great. We can use it to tune up the model even further.Â

Â

BN: “Approaches” refers to what I assume in your model is agents coming into sufficient physical-coordinates proximity to effect influence.

RM: Yes, where “sufficient proximity” means proximity to another person in the population to whom you are currently closest.

Â

BN: This models the conventional view in historical linguistics, namely, that convergence of pronunciation among members of a speech community is a function of frequency of intercommunication.

RM: Yes, indeed.Â

Â

BN: Agents getting close is a proxy for people talking with each other. But Labov’s finding (replicated now many times and in diverse ways) was that “proximity” must be defined in multivariate terms, including various perceived aspects of personal, social, and group attributes.

 RM: Yes, and, as I noted above, these variables will surely have to be added to the model in order to account for the fact that the different populations stabilize at different average pronunciation values.

BN: “Proximity” in the CROWD sense stands as a proxy for “the social motivations of sound change” (the title of Labov’s paper). His central demonstration is that the geographic partition into up-Island (au .33 vs. .66) and down-Island shown in the early table is incidental. The sharpest distinction is kind of like Brexit, young people staying or leaving, on p. 300 (the narrowest difference .40 vs. .90), with the highest indices (au 1.11 and 2.11, p. 298) for a fisherman father and his son who first went away to get a college degree, “tried city life and didn’t care for it” and then returned and set himself up in business in the Chilmark fishing world. Physical proximity does not account for that.

RM: I think proximity will have to be part of the deal; I can’t imagine that it is possible to build a plausible model of pronunciation change without having people talk to each other, which does not have to occur by physical proximity, of course, but people would have to at least be able to hear how other people pronounce things relative to themselves and change based on the difference. I think that the social and age variables that Labov talks about (and has data on) should be added to the model as variables that affect which of the people to which one is talking is a person to be imitated. I think the next step in this modeling exercise should be adding one of those social variables to show how this can affect the stable state to which the average pronunciation in a population converges. When I get a chance I’ll so that and let you know how it works. But in the meantime if you know of any other papers that have data relevant to pronunciation drift I’d like to see them.

BestÂ

Rick

/Bruce

On Sun, Nov 25, 2018 at 5:06 PM Richard Marken csgnet@lists.illinois.edu wrote:

[Rick Marken 2018-11-25_13:58:50]

[Bruce Nevin 2018-11-24_20:03:40 UTC]

Â

BN: Yes, this is much better. It’s a partial model of dialect divergence. Partial: as you say, among the conditions for emulation it includes only proximity. And it is unclear what is being controlled.

RM: In the model, what is being controlled is the difference between a person’s own pronunciation, call it pSelfCI, and the pronunciation of the currently closest other person, call it pOtherCI. So the controlled variable for each individual is pSelfCI-pOtherCI. The model equations for each individual are as follows:Â

System (person) equation:Â

Output (t) = Output(t-tau)Â + slow * (gain* (r - (pSelfCI(t) - pOtherCI(t))-Output (t-tau)Â Â Â Â Â (1)

Environment equation:

pSelfCI(t) = pSelfCI (t-tau) +Output(t) + d                                     (2)

The Output variable corresponds to changes in the configuration of the vocal tract that bring the perception of your pronunciation of /au/ to match that of the other person you are close to (and presumably talking to). The reference for the controlled perception, r, is 0 so the actual computer code for the system equation is:

Output (t) = Output(t-tau)Â + slow * (gain* (- (pSelfCI(t) - pOtherCI(t))-Output (t-tau)Â Â

RM: The values of slow and gain are the same for all individuals and selected to produce stable control. And d represents random disturbances to your own pronunciation of /au/, such as slight variations in the shape of the vocal tract like dryness and the amount of food in the mouth.

RM: So equations (1) and (2) are the model of each individual. Each individual is controlling the difference between how they and the person currently nearest to them pronounce /au/ in terms of CI index, and they are controlling for this difference being 0.Â

Â

BN: It sounds like cause-effect: proximity to another causes convergence of an ‘internal’ value (more like an attribute) toward that of the other.

RM: That’s why modeling is so important. A verbal description of the model may sound like cause and effect but with the model you can point to the equations and show that there is actually a closed loop of cause and effect which results in control of the difference between one’s own and the closest other person’s pronunciation of a diphthong.

Â

BN: You haven’t indicated how many approaches occur during a run that are close enough to trip this convergence of references.

RM: The convergence of the lower level references for pronouncing /au/ (a convergence that is implicit rather than explicit in this single level model) occurs via control for 0 difference between self and other pronunciation of /au/. This convergence is, thus, constantly occurring. What varies during a run is the distance between each individual and every other individual.

Â

BN: Observationally, change within a speech community is rather slow, typically requiring decades in stable social conditions. Are there enough ‘contacts’ for any given agent during a run to correlate with the number of speech interactions over a decade or so? A preference for approximating one kind of exemplary person and/or distancing oneself from the other kind of exemplar would have a slowing effect on the convergence.Â

RM: These are things that should be handled by extensions of the model, if the relevant data exists to know how it should be extended. Right now, all the model does is show that different groups, each containing people who are controlling for pronouncing a diphthong the way others in their group pronounce it, will converge to different, consistent ways of pronouncing the diphthong. In other words, it accounts for the data in Labov’s Table 3.Â

BN: Stepping back to naturalistic observation to speculate about potential variables…

RM: Interesting observations.Â

Â

BN: I expect that a number of potentially controlled perceptions can be identified for testing or for indirect verification wrt documented observations. A fundamental reference is Milton Mazer’s People and predicaments: Of life and distress on Martha’s Vineyard, HUP 1976, dealing very closely with the time period of Labov’s observations.

RM: Great. That could be useful, indeed.Â

RM: This is really interesting stuff and I would really like to keep working on it. But I’ve got other priorities at the moment but I could elevate the priority of this work if I could get a linguist or sociologist to work on it with me.  Â

BN: Well, you’ve got one linguist here.

RM: Super.

BestÂ

Rick

Â

d Marken csgnet@lists.illinois.edu wrote:

[Rick Marken 2018-11-24_10:14:44]

RM: Thanks for all the nice comments. But it turns out that the model results are plotted were based on a faulty model. My mistake was small by crucial: I basically got the error calculation in the model wrong so that the result was a positive feedback loop which I had limited by limiting the perceptual input to be no greater than the limits found in the data. I discovered this error while trying to think of how to get the model to converge to CI averages other than .66 and .33.Â

RM: When I fixed the model, things went even better than they had with the original, incorrect model. Here’s the results of one run:

image.png

RM: The reason this result is better is that the model converges (by chance) to different CI values on each run. The graph above shows only on result; the model converges to quite different values for the Up and Down Islanders on each run. This is a feature, not a bug, because it can account for the differences in CI averages for the subgroups in the Up and Down Island groups, as in this table:

Â

RM: Anyway, there is much more to do with the model. The main thing being to see if control for matching pronunciation based on variables besides proximity alone – such as the prestige of the speaker – would get the model to the different observed difference in average CI.Â

RM: This is really interesting stuff and I would really like to keep working on it. But I’ve got other priorities at the moment but I could elevate the priority of this work if I could get a linguist or sociologist to work on it with me.Â

BestÂ

Rick


Richard S. MarkenÂ

"Perfection is achieved not when you have nothing more to add, but when you
have nothing left to take away.�
                --Antoine de Saint-Exupery


Richard S. MarkenÂ

"Perfection is achieved not when you have nothing more to add, but when you
have nothing left to take away.�
                --Antoine de Saint-Exupery


Richard S. MarkenÂ

"Perfection is achieved not when you have nothing more to add, but when you
have nothing left to take away.�
                --Antoine de Saint-Exupery


Richard S. MarkenÂ

"Perfection is achieved not when you have nothing more to add, but when you
have nothing left to take away.�
                --Antoine de Saint-Exupery

[Rick Marken 2018-12-02_11:06:32]
Â

[Bruce Nevin 2018-12-01_19:54:41 UTC]

BN:Forgot to say – I’m hoping we develop something worth a presentation or maybe a poster at LSA.

RM: That would be great!

Â

BN: The 2020 meeting is in New Orleans, then SF in 2021. Hence my interest in the relationship to parameters that linguists know about.

 RM: I’ll be counting on you to help get us there! I’ve never been to The Big Easy but I am going there next year around Mardi Gras because one of our good friends will be celebrated at a ball honoring the 50th anniversary of her being queen of the Mardi Gras. So if we don’t make the 2020 LSA meeting it will be OK. I love San Francisco.Â

BestÂ

Rick

image549.png

image548.png

image542.png

···

Richard S. MarkenÂ

"Perfection is achieved not when you have nothing more to add, but when you
have nothing left to take away.�
                --Antoine de Saint-Exupery

[Bruce Nevin 2018-12-05_14:48:28 UTC]

Rick Marken 2018-12-02_10:59:09 –

RM: The average CI values for /ai/ are quite consistent across regions and age for all the fishermen. But the average CI values for /au/ are all over the map. Look, for example, at Chilmark, where the CI average range from .79 to 2.11, and those extremes come from fishermen living in the the same region who are nearly the same age. This kind of data is inconsistent with the model as it currently exists. But that’s fine; it shows how important data is!

Yes, that is fascinating–because the -ai- diphthong is the innovation, whereas the -au- is the retention from 18th century London>Colonial English. But the CI values of -au- are still all above 1.0 (with the exception of one of the two youngest Chilmark fishermen, at 0.79), and the down-Island + W/N Tisbury -au- values are all below 0.55. (He has included the rural part of Oak Bluffs as though up Island, though it is decidedly a down-Island town, on the coast between Edgartown and Vineyard Haven, but it is a port in summer and the town has long had attractions specifically for the tourist trade, bringing the native/visitor contacts into sharp focus.)

Capture2.JPG

I have not located specific data-rich publications yet (some are in books that I could cite), but here is an interesting article on quantitative research in linguistics which surveys a lot of such work.

https://www.ling.upenn.edu/~wlabov/Papers/QRL.pdf

And here is his own listing of his works on language change:

https://www.ling.upenn.edu/~wlabov/#Language%20change

I’ll get back to this as I can. I have to get on the 10:30 boat to go take my off-Island car to the dealership for a recall notice plus routine service, so that will take essentially the rest of the day. Part of the cost of living here.

image548.png

image549.png

image542.png

image559.png

···

/Bruce

On Sun, Dec 2, 2018 at 2:00 PM Richard Marken csgnet@lists.illinois.edu wrote:

[Rick Marken 2018-12-02_10:59:09]

[Bruce Nevin 2018-12-01_19:39:53 UTC]

RM: if you know of any other papers that have data relevant to pronunciation drift I’d like to see them.

BN: I’ll get some to you.

RM: Super!Â

BN: I believe you have said that the average CI settles down as the individual CI values converge toward a common value, in other words, they are two aspects of the same process, but it would take a different display to show the individual values converging in a given population concurrently as the average beomes stable.

 RM: Yes, I’ll work on that. It would be nice to see what the convergence within a population looks like over time. What I do know is that the variance of the CI values within the population decreases substantially over the course of the simulation.  That’s what stability is, after all; reduced variability. Unfortunately, Labov didn’t report the variance of the CI scores within the different populations that he observed so we don’t know if the model is converging too much or too little. Some evidence that this variance is considerable come from this table:

image.png

RM: The average CI values for /ai/ are quite consistent across regions and age for all the fishermen. But the average CI values for /au/ are all over the map. Look, for example, at Chilmark, where the CI average range from .79 to 2.11, and those extremes come from fishermen living in the the same region who are nearly the same age. This kind of data is inconsistent with the model as it currently exists. But that’s fine; it shows how important data is!

RM: This implies that you have seen data on how many effective approaches per unit time it takes to reach a stable average pronunciation value. That’s great. We can use it to tune up the model even further.Â

BN: No, the only data I know of about frequency of conversations are chat metrics, where computers can keep count because they are the ‘speech organs’. Â

 RM: OK, I think we have other problems to solve before we get down to that level of detail!

BN: Rabbit Hole Department: For another perspective, I just looked for some data on how long it takes a newly deaf person’s speech to ‘drift’ from the person’s previous reference values. Not surprisingly, I couldn’t find anything–for some reason, other people don’t think about things in the perfectly reasonable ways that we do. But I did find this interesting experiment in which deaf speakers resist a mild disturbance to jaw position which hearing speakers do not resist.Â

https://www.nature.com/articles/nn.2193

 RM: What a great find! It doesn’t seem like they compared the results of the deaf with those for normal hearing people. Too bad but, still, it’s apparently a paper that I can use. Thanks!

BestÂ

Rick

I got there from https://www.newscientist.com/article/mg19926745-500-deaf-people-feel-the-correct-pronunciation/

/Bruce

On Thu, Nov 29, 2018 at 7:29 PM Richard Marken csgnet@lists.illinois.edu wrote:

 [Rick Marken 2018-11-29_15:18:10]

[Bruce Nevin 2018-11-28_16:15:08 UTC]

BN: Rick Marken 2018-11-25_13:58:50 –

BN: Thanks much.Â

RM: Thank you!Â

BN: Omitted is what governs proximity. Unlike CROWD, movements and therefore pairwise proximities are random within each population, I assume.

RM: Yes. My model uses a kludgy approach to moving individuals around; I have the people moving sinusoidally and computing their distance from each other in terms of how close each of their current sine wave values is to each other. Eventually I will have the people mill around quasi randomly in 2-D space and calculate proximity in terms of euclidean distance. But I think the current simple model correctly shows how the model works.Â

Â

RM: The convergence of the lower level references for pronouncing /au/ (a convergence that is implicit rather than explicit in this single level model) occurs via control for 0 difference between self and other pronunciation of /au/. This convergence is, thus, constantly occurring. What varies during a run is the distance between each individual and every other individual.

BN: I mean convergence of the population as a whole. This is of course the cumulative result of successive convergences between pairs of agents (or sometimes more than two come close enough together, I suppose), which is what you understandably took me to mean.

RM: Actually, the convergence of the population as a whole to a particular pronunciation is a side effect of the convergences of the pronunciations between pairs of agents that results from each agent controlling for pronouncing like the agent currently closest to it. And because the proximity of one individual to another in the population varies randomly the pronunciation average to which the population converges can be quite different for populations that start with the same average pronunciation. Here’s a couple of different runs of the model to show what I mean:

Â

image.png

image.png

RM: The graphs show the average pronunciation (in terms of CI) of populations (Groups) varying over time. Each Group is a separate population consisting of 10 interacting speakers. Each graph shows a simulation involving three Groups, all three of which start with the same average pronunciation. As you can see, over time the average pronunciation converges to a different stable (fairly constant) value – that stable value being a side effect of each individual controlling for 0 difference between it’s own pronunciation and that of the others in the populations. Notice in the top graph how each population, starting at the same average CI value, ends up stabilized at different average CI values. The same happens in the lower graph but I put it in to show that the CI average at which each population gets stabilized is different on each run.Â

RM: What this means is that, in order to get these proximity based pronunciation averages to correspond to the data, we will have to add something to the model that will make this happen. And I think this is where the data on the CI averages as a function of age and social variables will come in.

BN: Putting my question another way, if the change in question occurred over a period of 50 years, how many conversations will have occurred between members of the population during that time?

RM: That could be calculated from the model. But I don’t think it’s worth doing that since there is no data at hand that I know of against which the model results could be compared.

Â

BN: I am supposing that the number of effective approaches in a run of the model is a tiny fraction of that number.

RM: This implies that you have seen data on how many effective approaches per unit time it takes to reach a stable average pronunciation value. That’s great. We can use it to tune up the model even further.Â

Â

BN: “Approaches” refers to what I assume in your model is agents coming into sufficient physical-coordinates proximity to effect influence.

RM: Yes, where “sufficient proximity” means proximity to another person in the population to whom you are currently closest.

Â

BN: This models the conventional view in historical linguistics, namely, that convergence of pronunciation among members of a speech community is a function of frequency of intercommunication.

RM: Yes, indeed.Â

Â

BN: Agents getting close is a proxy for people talking with each other. But Labov’s finding (replicated now many times and in diverse ways) was that “proximity” must be defined in multivariate terms, including various perceived aspects of personal, social, and group attributes.

 RM: Yes, and, as I noted above, these variables will surely have to be added to the model in order to account for the fact that the different populations stabilize at different average pronunciation values.

BN: “Proximity” in the CROWD sense stands as a proxy for “the social motivations of sound change” (the title of Labov’s paper). His central demonstration is that the geographic partition into up-Island (au .33 vs. .66) and down-Island shown in the early table is incidental. The sharpest distinction is kind of like Brexit, young people staying or leaving, on p. 300 (the narrowest difference .40 vs. .90), with the highest indices (au 1.11 and 2.11, p. 298) for a fisherman father and his son who first went away to get a college degree, “tried city life and didn’t care for it” and then returned and set himself up in business in the Chilmark fishing world. Physical proximity does not account for that.

RM: I think proximity will have to be part of the deal; I can’t imagine that it is possible to build a plausible model of pronunciation change without having people talk to each other, which does not have to occur by physical proximity, of course, but people would have to at least be able to hear how other people pronounce things relative to themselves and change based on the difference. I think that the social and age variables that Labov talks about (and has data on) should be added to the model as variables that affect which of the people to which one is talking is a person to be imitated. I think the next step in this modeling exercise should be adding one of those social variables to show how this can affect the stable state to which the average pronunciation in a population converges. When I get a chance I’ll so that and let you know how it works. But in the meantime if you know of any other papers that have data relevant to pronunciation drift I’d like to see them.

BestÂ

Rick

/Bruce

On Sun, Nov 25, 2018 at 5:06 PM Richard Marken csgnet@lists.illinois.edu wrote:

[Rick Marken 2018-11-25_13:58:50]

[Bruce Nevin 2018-11-24_20:03:40 UTC]

Â

BN: Yes, this is much better. It’s a partial model of dialect divergence. Partial: as you say, among the conditions for emulation it includes only proximity. And it is unclear what is being controlled.

RM: In the model, what is being controlled is the difference between a person’s own pronunciation, call it pSelfCI, and the pronunciation of the currently closest other person, call it pOtherCI. So the controlled variable for each individual is pSelfCI-pOtherCI. The model equations for each individual are as follows:Â

System (person) equation:Â

Output (t) = Output(t-tau)Â + slow * (gain* (r - (pSelfCI(t) - pOtherCI(t))-Output (t-tau)Â Â Â Â Â (1)

Environment equation:

pSelfCI(t) = pSelfCI (t-tau) +Output(t) + d                                     (2)

The Output variable corresponds to changes in the configuration of the vocal tract that bring the perception of your pronunciation of /au/ to match that of the other person you are close to (and presumably talking to). The reference for the controlled perception, r, is 0 so the actual computer code for the system equation is:

Output (t) = Output(t-tau)Â + slow * (gain* (- (pSelfCI(t) - pOtherCI(t))-Output (t-tau)Â Â

RM: The values of slow and gain are the same for all individuals and selected to produce stable control. And d represents random disturbances to your own pronunciation of /au/, such as slight variations in the shape of the vocal tract like dryness and the amount of food in the mouth.

RM: So equations (1) and (2) are the model of each individual. Each individual is controlling the difference between how they and the person currently nearest to them pronounce /au/ in terms of CI index, and they are controlling for this difference being 0.Â

Â

BN: It sounds like cause-effect: proximity to another causes convergence of an ‘internal’ value (more like an attribute) toward that of the other.

RM: That’s why modeling is so important. A verbal description of the model may sound like cause and effect but with the model you can point to the equations and show that there is actually a closed loop of cause and effect which results in control of the difference between one’s own and the closest other person’s pronunciation of a diphthong.

Â

BN: You haven’t indicated how many approaches occur during a run that are close enough to trip this convergence of references.

RM: The convergence of the lower level references for pronouncing /au/ (a convergence that is implicit rather than explicit in this single level model) occurs via control for 0 difference between self and other pronunciation of /au/. This convergence is, thus, constantly occurring. What varies during a run is the distance between each individual and every other individual.

Â

BN: Observationally, change within a speech community is rather slow, typically requiring decades in stable social conditions. Are there enough ‘contacts’ for any given agent during a run to correlate with the number of speech interactions over a decade or so? A preference for approximating one kind of exemplary person and/or distancing oneself from the other kind of exemplar would have a slowing effect on the convergence.Â

RM: These are things that should be handled by extensions of the model, if the relevant data exists to know how it should be extended. Right now, all the model does is show that different groups, each containing people who are controlling for pronouncing a diphthong the way others in their group pronounce it, will converge to different, consistent ways of pronouncing the diphthong. In other words, it accounts for the data in Labov’s Table 3.Â

BN: Stepping back to naturalistic observation to speculate about potential variables…

RM: Interesting observations.Â

Â

BN: I expect that a number of potentially controlled perceptions can be identified for testing or for indirect verification wrt documented observations. A fundamental reference is Milton Mazer’s People and predicaments: Of life and distress on Martha’s Vineyard, HUP 1976, dealing very closely with the time period of Labov’s observations.

RM: Great. That could be useful, indeed.Â

RM: This is really interesting stuff and I would really like to keep working on it. But I’ve got other priorities at the moment but I could elevate the priority of this work if I could get a linguist or sociologist to work on it with me.  Â

BN: Well, you’ve got one linguist here.

RM: Super.

BestÂ

Rick

Â

d Marken csgnet@lists.illinois.edu wrote:

[Rick Marken 2018-11-24_10:14:44]

RM: Thanks for all the nice comments. But it turns out that the model results are plotted were based on a faulty model. My mistake was small by crucial: I basically got the error calculation in the model wrong so that the result was a positive feedback loop which I had limited by limiting the perceptual input to be no greater than the limits found in the data. I discovered this error while trying to think of how to get the model to converge to CI averages other than .66 and .33.Â

RM: When I fixed the model, things went even better than they had with the original, incorrect model. Here’s the results of one run:

image.png

RM: The reason this result is better is that the model converges (by chance) to different CI values on each run. The graph above shows only on result; the model converges to quite different values for the Up and Down Islanders on each run. This is a feature, not a bug, because it can account for the differences in CI averages for the subgroups in the Up and Down Island groups, as in this table:

Â

RM: Anyway, there is much more to do with the model. The main thing being to see if control for matching pronunciation based on variables besides proximity alone – such as the prestige of the speaker – would get the model to the different observed difference in average CI.Â

RM: This is really interesting stuff and I would really like to keep working on it. But I’ve got other priorities at the moment but I could elevate the priority of this work if I could get a linguist or sociologist to work on it with me.Â

BestÂ

Rick


Richard S. MarkenÂ

"Perfection is achieved not when you have nothing more to add, but when you
have nothing left to take away.�
                --Antoine de Saint-Exupery


Richard S. MarkenÂ

"Perfection is achieved not when you have nothing more to add, but when you
have nothing left to take away.�
                --Antoine de Saint-Exupery


Richard S. MarkenÂ

"Perfection is achieved not when you have nothing more to add, but when you
have nothing left to take away.�
                --Antoine de Saint-Exupery


Richard S. MarkenÂ

"Perfection is achieved not when you have nothing more to add, but when you
have nothing left to take away.�
                --Antoine de Saint-Exupery

[Rick Marken 2018-12-07_09:28:34]

[Bruce Nevin 2018-12-05_14:48:28 UTC]

Rick Marken 2018-12-02_10:59:09 –

RM: The average CI values for /ai/ are quite consistent across regions and age for all the fishermen. But the average CI values for /au/ are all over the map. Look, for example, at Chilmark, where the CI average range from .79 to 2.11, and those extremes come from fishermen living in the the same region who are nearly the same age. This kind of data is inconsistent with the model as it currently exists. But that’s fine; it shows how important data is!

BN: Yes, that is fascinating–because the -ai- diphthong is the innovation, whereas the -au- is the retention from 18th century London>Colonial English…

RM: Just thought I’d show you the results from a couple of model runs where I took your suggestion and traced out the sound change paths of the individuals in the population rather than the population average. The results were very interesting. Here’s one:Â

image559.png

RM: Note that, completely by chance two subsets of the population break apart in their pronunciation. This could be what we are seeing in the case of data like this:

image548.png

Â

RM: where we see people of the same occupation and age in the same place (Chikmark) ending up with very different pronunciations. But we also get runs that look like this:

image549.png

RM: where everyone is changing in the same way.Â

RM: What this means is that some of the observed differences in pronunciation that appear to be a result of social and age factors may actually by a result of chance differences in the way people interact withing a population. We need more data!!

BestÂ

Rick

image542.png

image571.png

image559.png

image573.png

···

I have not located specific data-rich publications yet (some are in books that I could cite), but here is an interesting article on quantitative research in linguistics which surveys a lot of such work.

https://www.ling.upenn.edu/~wlabov/Papers/QRL.pdf

And here is his own listing of his works on language change:

https://www.ling.upenn.edu/~wlabov/#Language%20change

I’ll get back to this as I can. I have to get on the 10:30 boat to go take my off-Island car to the dealership for a recall notice plus routine service, so that will take essentially the rest of the day. Part of the cost of living here.

/Bruce

On Sun, Dec 2, 2018 at 2:00 PM Richard Marken csgnet@lists.illinois.edu wrote:

[Rick Marken 2018-12-02_10:59:09]

[Bruce Nevin 2018-12-01_19:39:53 UTC]

RM: if you know of any other papers that have data relevant to pronunciation drift I’d like to see them.

BN: I’ll get some to you.

RM: Super!Â

BN: I believe you have said that the average CI settles down as the individual CI values converge toward a common value, in other words, they are two aspects of the same process, but it would take a different display to show the individual values converging in a given population concurrently as the average beomes stable.

 RM: Yes, I’ll work on that. It would be nice to see what the convergence within a population looks like over time. What I do know is that the variance of the CI values within the population decreases substantially over the course of the simulation.  That’s what stability is, after all; reduced variability. Unfortunately, Labov didn’t report the variance of the CI scores within the different populations that he observed so we don’t know if the model is converging too much or too little. Some evidence that this variance is considerable come from this table:

image.png

RM: The average CI values for /ai/ are quite consistent across regions and age for all the fishermen. But the average CI values for /au/ are all over the map. Look, for example, at Chilmark, where the CI average range from .79 to 2.11, and those extremes come from fishermen living in the the same region who are nearly the same age. This kind of data is inconsistent with the model as it currently exists. But that’s fine; it shows how important data is!

RM: This implies that you have seen data on how many effective approaches per unit time it takes to reach a stable average pronunciation value. That’s great. We can use it to tune up the model even further.Â

BN: No, the only data I know of about frequency of conversations are chat metrics, where computers can keep count because they are the ‘speech organs’. Â

 RM: OK, I think we have other problems to solve before we get down to that level of detail!

BN: Rabbit Hole Department: For another perspective, I just looked for some data on how long it takes a newly deaf person’s speech to ‘drift’ from the person’s previous reference values. Not surprisingly, I couldn’t find anything–for some reason, other people don’t think about things in the perfectly reasonable ways that we do. But I did find this interesting experiment in which deaf speakers resist a mild disturbance to jaw position which hearing speakers do not resist.Â

https://www.nature.com/articles/nn.2193

 RM: What a great find! It doesn’t seem like they compared the results of the deaf with those for normal hearing people. Too bad but, still, it’s apparently a paper that I can use. Thanks!

BestÂ

Rick

I got there from https://www.newscientist.com/article/mg19926745-500-deaf-people-feel-the-correct-pronunciation/

/Bruce

On Thu, Nov 29, 2018 at 7:29 PM Richard Marken csgnet@lists.illinois.edu wrote:

 [Rick Marken 2018-11-29_15:18:10]

[Bruce Nevin 2018-11-28_16:15:08 UTC]

BN: Rick Marken 2018-11-25_13:58:50 –

BN: Thanks much.Â

RM: Thank you!Â

BN: Omitted is what governs proximity. Unlike CROWD, movements and therefore pairwise proximities are random within each population, I assume.

RM: Yes. My model uses a kludgy approach to moving individuals around; I have the people moving sinusoidally and computing their distance from each other in terms of how close each of their current sine wave values is to each other. Eventually I will have the people mill around quasi randomly in 2-D space and calculate proximity in terms of euclidean distance. But I think the current simple model correctly shows how the model works.Â

Â

RM: The convergence of the lower level references for pronouncing /au/ (a convergence that is implicit rather than explicit in this single level model) occurs via control for 0 difference between self and other pronunciation of /au/. This convergence is, thus, constantly occurring. What varies during a run is the distance between each individual and every other individual.

BN: I mean convergence of the population as a whole. This is of course the cumulative result of successive convergences between pairs of agents (or sometimes more than two come close enough together, I suppose), which is what you understandably took me to mean.

RM: Actually, the convergence of the population as a whole to a particular pronunciation is a side effect of the convergences of the pronunciations between pairs of agents that results from each agent controlling for pronouncing like the agent currently closest to it. And because the proximity of one individual to another in the population varies randomly the pronunciation average to which the population converges can be quite different for populations that start with the same average pronunciation. Here’s a couple of different runs of the model to show what I mean:

Â

image.png

image.png

RM: The graphs show the average pronunciation (in terms of CI) of populations (Groups) varying over time. Each Group is a separate population consisting of 10 interacting speakers. Each graph shows a simulation involving three Groups, all three of which start with the same average pronunciation. As you can see, over time the average pronunciation converges to a different stable (fairly constant) value – that stable value being a side effect of each individual controlling for 0 difference between it’s own pronunciation and that of the others in the populations. Notice in the top graph how each population, starting at the same average CI value, ends up stabilized at different average CI values. The same happens in the lower graph but I put it in to show that the CI average at which each population gets stabilized is different on each run.Â

RM: What this means is that, in order to get these proximity based pronunciation averages to correspond to the data, we will have to add something to the model that will make this happen. And I think this is where the data on the CI averages as a function of age and social variables will come in.

BN: Putting my question another way, if the change in question occurred over a period of 50 years, how many conversations will have occurred between members of the population during that time?

RM: That could be calculated from the model. But I don’t think it’s worth doing that since there is no data at hand that I know of against which the model results could be compared.

Â

BN: I am supposing that the number of effective approaches in a run of the model is a tiny fraction of that number.

RM: This implies that you have seen data on how many effective approaches per unit time it takes to reach a stable average pronunciation value. That’s great. We can use it to tune up the model even further.Â

Â

BN: “Approaches” refers to what I assume in your model is agents coming into sufficient physical-coordinates proximity to effect influence.

RM: Yes, where “sufficient proximity” means proximity to another person in the population to whom you are currently closest.

Â

BN: This models the conventional view in historical linguistics, namely, that convergence of pronunciation among members of a speech community is a function of frequency of intercommunication.

RM: Yes, indeed.Â

Â

BN: Agents getting close is a proxy for people talking with each other. But Labov’s finding (replicated now many times and in diverse ways) was that “proximity” must be defined in multivariate terms, including various perceived aspects of personal, social, and group attributes.

 RM: Yes, and, as I noted above, these variables will surely have to be added to the model in order to account for the fact that the different populations stabilize at different average pronunciation values.

BN: “Proximity” in the CROWD sense stands as a proxy for “the social motivations of sound change” (the title of Labov’s paper). His central demonstration is that the geographic partition into up-Island (au .33 vs. .66) and down-Island shown in the early table is incidental. The sharpest distinction is kind of like Brexit, young people staying or leaving, on p. 300 (the narrowest difference .40 vs. .90), with the highest indices (au 1.11 and 2.11, p. 298) for a fisherman father and his son who first went away to get a college degree, “tried city life and didn’t care for it” and then returned and set himself up in business in the Chilmark fishing world. Physical proximity does not account for that.

RM: I think proximity will have to be part of the deal; I can’t imagine that it is possible to build a plausible model of pronunciation change without having people talk to each other, which does not have to occur by physical proximity, of course, but people would have to at least be able to hear how other people pronounce things relative to themselves and change based on the difference. I think that the social and age variables that Labov talks about (and has data on) should be added to the model as variables that affect which of the people to which one is talking is a person to be imitated. I think the next step in this modeling exercise should be adding one of those social variables to show how this can affect the stable state to which the average pronunciation in a population converges. When I get a chance I’ll so that and let you know how it works. But in the meantime if you know of any other papers that have data relevant to pronunciation drift I’d like to see them.

BestÂ

Rick

/Bruce

On Sun, Nov 25, 2018 at 5:06 PM Richard Marken csgnet@lists.illinois.edu wrote:

[Rick Marken 2018-11-25_13:58:50]

[Bruce Nevin 2018-11-24_20:03:40 UTC]

Â

BN: Yes, this is much better. It’s a partial model of dialect divergence. Partial: as you say, among the conditions for emulation it includes only proximity. And it is unclear what is being controlled.

RM: In the model, what is being controlled is the difference between a person’s own pronunciation, call it pSelfCI, and the pronunciation of the currently closest other person, call it pOtherCI. So the controlled variable for each individual is pSelfCI-pOtherCI. The model equations for each individual are as follows:Â

System (person) equation:Â

Output (t) = Output(t-tau)Â + slow * (gain* (r - (pSelfCI(t) - pOtherCI(t))-Output (t-tau)Â Â Â Â Â (1)

Environment equation:

pSelfCI(t) = pSelfCI (t-tau) +Output(t) + d                                     (2)

The Output variable corresponds to changes in the configuration of the vocal tract that bring the perception of your pronunciation of /au/ to match that of the other person you are close to (and presumably talking to). The reference for the controlled perception, r, is 0 so the actual computer code for the system equation is:

Output (t) = Output(t-tau)Â + slow * (gain* (- (pSelfCI(t) - pOtherCI(t))-Output (t-tau)Â Â

RM: The values of slow and gain are the same for all individuals and selected to produce stable control. And d represents random disturbances to your own pronunciation of /au/, such as slight variations in the shape of the vocal tract like dryness and the amount of food in the mouth.

RM: So equations (1) and (2) are the model of each individual. Each individual is controlling the difference between how they and the person currently nearest to them pronounce /au/ in terms of CI index, and they are controlling for this difference being 0.Â

Â

BN: It sounds like cause-effect: proximity to another causes convergence of an ‘internal’ value (more like an attribute) toward that of the other.

RM: That’s why modeling is so important. A verbal description of the model may sound like cause and effect but with the model you can point to the equations and show that there is actually a closed loop of cause and effect which results in control of the difference between one’s own and the closest other person’s pronunciation of a diphthong.

Â

BN: You haven’t indicated how many approaches occur during a run that are close enough to trip this convergence of references.

RM: The convergence of the lower level references for pronouncing /au/ (a convergence that is implicit rather than explicit in this single level model) occurs via control for 0 difference between self and other pronunciation of /au/. This convergence is, thus, constantly occurring. What varies during a run is the distance between each individual and every other individual.

Â

BN: Observationally, change within a speech community is rather slow, typically requiring decades in stable social conditions. Are there enough ‘contacts’ for any given agent during a run to correlate with the number of speech interactions over a decade or so? A preference for approximating one kind of exemplary person and/or distancing oneself from the other kind of exemplar would have a slowing effect on the convergence.Â

RM: These are things that should be handled by extensions of the model, if the relevant data exists to know how it should be extended. Right now, all the model does is show that different groups, each containing people who are controlling for pronouncing a diphthong the way others in their group pronounce it, will converge to different, consistent ways of pronouncing the diphthong. In other words, it accounts for the data in Labov’s Table 3.Â

BN: Stepping back to naturalistic observation to speculate about potential variables…

RM: Interesting observations.Â

Â

BN: I expect that a number of potentially controlled perceptions can be identified for testing or for indirect verification wrt documented observations. A fundamental reference is Milton Mazer’s People and predicaments: Of life and distress on Martha’s Vineyard, HUP 1976, dealing very closely with the time period of Labov’s observations.

RM: Great. That could be useful, indeed.Â

RM: This is really interesting stuff and I would really like to keep working on it. But I’ve got other priorities at the moment but I could elevate the priority of this work if I could get a linguist or sociologist to work on it with me.  Â

BN: Well, you’ve got one linguist here.

RM: Super.

BestÂ

Rick

Â

d Marken csgnet@lists.illinois.edu wrote:

[Rick Marken 2018-11-24_10:14:44]

RM: Thanks for all the nice comments. But it turns out that the model results are plotted were based on a faulty model. My mistake was small by crucial: I basically got the error calculation in the model wrong so that the result was a positive feedback loop which I had limited by limiting the perceptual input to be no greater than the limits found in the data. I discovered this error while trying to think of how to get the model to converge to CI averages other than .66 and .33.Â

RM: When I fixed the model, things went even better than they had with the original, incorrect model. Here’s the results of one run:

image.png

RM: The reason this result is better is that the model converges (by chance) to different CI values on each run. The graph above shows only on result; the model converges to quite different values for the Up and Down Islanders on each run. This is a feature, not a bug, because it can account for the differences in CI averages for the subgroups in the Up and Down Island groups, as in this table:

Â

RM: Anyway, there is much more to do with the model. The main thing being to see if control for matching pronunciation based on variables besides proximity alone – such as the prestige of the speaker – would get the model to the different observed difference in average CI.Â

RM: This is really interesting stuff and I would really like to keep working on it. But I’ve got other priorities at the moment but I could elevate the priority of this work if I could get a linguist or sociologist to work on it with me.Â

BestÂ

Rick


Richard S. MarkenÂ

"Perfection is achieved not when you have nothing more to add, but when you
have nothing left to take away.�
                --Antoine de Saint-Exupery


Richard S. MarkenÂ

"Perfection is achieved not when you have nothing more to add, but when you
have nothing left to take away.�
                --Antoine de Saint-Exupery


Richard S. MarkenÂ

"Perfection is achieved not when you have nothing more to add, but when you
have nothing left to take away.�
                --Antoine de Saint-Exupery


Richard S. MarkenÂ

"Perfection is achieved not when you have nothing more to add, but when you
have nothing left to take away.�
                --Antoine de Saint-Exupery


Richard S. MarkenÂ

"Perfection is achieved not when you have nothing more to add, but when you
have nothing left to take away.�
                --Antoine de Saint-Exupery