[From Rick Marken (2016.07.24.1220)]
Martin Taylor (16.07.20.21.19)
MT: If “V” is a true velocity, then the dots signify derivatives with respect to time. If “R” is the radius of curvature, it’s a length and the dots signify derivatives with respect to arc length along the curve. They aren’t the same thing, but you use your “kindergarten math” as though they are…
MT: I’m leaving the rest of my message in this one so you won’t have to look back a few hours in the archive if you ever decide you want to read the explanation of why I am quite certain your V = |dXd2Y-d2XdY| 1/3 *R1/3 formula not just wrong, but just so nonsensical as to be neither right nor wrong.
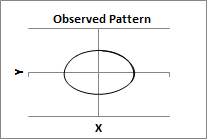
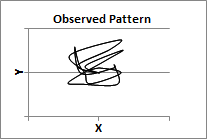
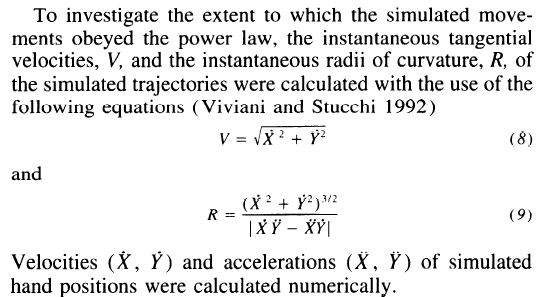
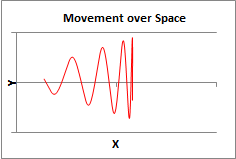
RM: The power law is tested using linear regression with log(R) as the predictor variable and log(V) as the criterion variable. The variables R (the measure of instantaneous curvature) and V (the measure of instantaneous velocity) are computed from the movements that produce the final pattern. For example, here is an example of an elliptical movement pattern:
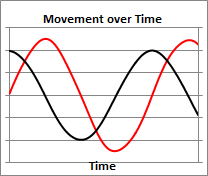
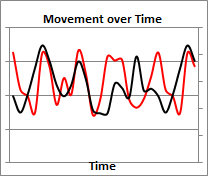
RM: The top figure shows the two dimensional elliptical pattern created by the counter-clockwise movement of a point in the X and Y dimension simultaneously over time, as shown in the lower figure (the red line is movement in the X dimension and the black line is movement in the Y dimension).
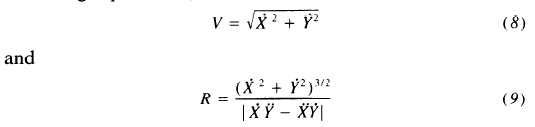
RM: To do the regression of log(R) on log (V) the values of R and V are computed for each point in time during which the movement is made. I found the formulas for computing R and V in Gribble & Ostry (1996). J. Neurophysiology, 76(5), 2853-2860. The value of V (velocity) at each point in the movement pattern is computed as as follows:
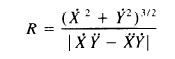
and the value of R (curvature) is computed at each point as follows:
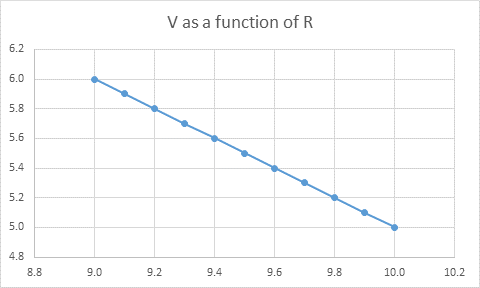
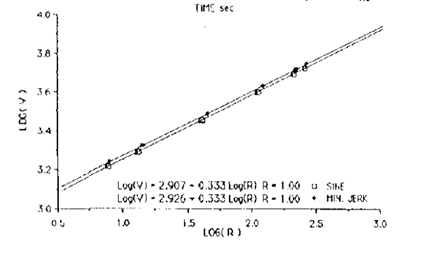
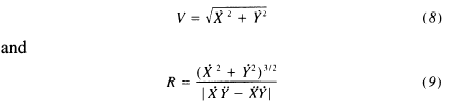
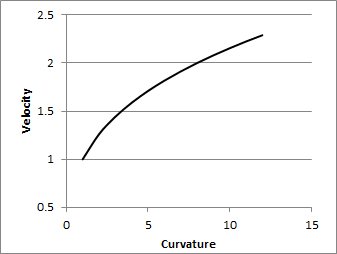
RM: These are formulas I used for computing V and R in my spreadsheet analysis of the power law. If R and V are related by a power law then there will be a linear relationship between log (R) and log (V) and the slope of the relationship will be a measure of the coefficient of the power function. Below is a graph of the relationship between log (R) and log (V) for an elliptical pattern of movement like that shown above:
Testing the Curvature- Velocity (110 Bytes)
Testing the Curvature- Velocity1 (111 Bytes)
![]()
![]()
![]()
![]()
PowerLawRegression.xlsm (577 KB)
···
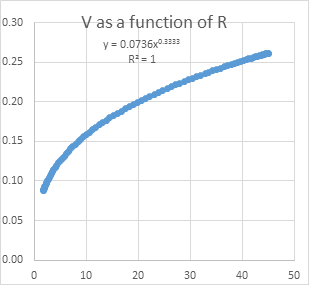
RM: This graph is from Wann, Nimmo-Smith & Wing (1988).JEP: HPP, 14(4), 622. The two lines are for elliptical movements that were generated in two different ways: 1) using two sine waves (a Lissajous pattern) and 2) using a movement generation process called a “jerk” model. In both cases the relationship between log (R) and log (V) is precisely linear (R^2 = 1.0) and the coefficient of the power function is .33. I found the same relationship between log (R) and log (V) for ellipsoidal movement created by a control model, even for control models with different output and feedback functions.
RM: The fact that a power law (with a coefficient of .33) was found for elliptical movements that had been produced by many different processes suggested to me that the relationship between log (R) and log (V) may depend only on the nature of the movement pattern itself and not on how that movement pattern was produced. Since R and V are both measured from the movement pattern (the same values of the derivatives of X and Y movement are used in the computation of both R and V) I looked to see if there might be a mathematical relationship between V and R.
RM: Looking at the formulas for V and R I noticed that V2 = X.dot2+Y.dot2 , which is a term in the numerator in the formula for R. See for yourself in the equations for V and R above. So the equation for R can be re-wriitten as
R = (V2)3//2 |/ |X.dotY.2dot-X.2dotY.dot|
And from there it’s a couple steps to:
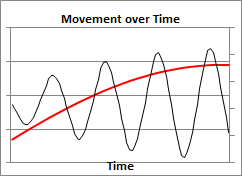
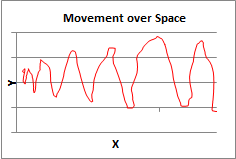
RM: This movement pattern was created by a human (me) moving a mouse around the computer screen. Here’s the pattern of movement over time:
RM: A regression analysis of this pattern of movement with log (R) as the predictor and log (V) as the criterion results in am R^2 value of 1.0 and a b coefficient (the power law coefficient) of .33. I get the same results (R^2 = 1.0, b = .33) for every movement pattern I have analyzed , as long as there was no point in the pattern where the derivative of X, X.dot, equaled the derivative of Y, Y.dot.
RM: These results show that it is impossible to learn
anything about how movements are produced by looking at the relationship
between measures of the movements themselves. The observed relationship between
variable aspect of the movement, such as V and R, reflects nothing more than a
mathematical relationship which, in this case, can be written as
V = D1/3 *R1/3
RM: And this equation can be found by simply observing that
the equation that defines V is part of the equation that defines R.
RM: So the big question is why did all the researchers in
this area fail to see either that this mathematical relationship between V and R
exists or, if they did know that it exists, why did they fail to see its
implication, which is that any observed relationship between V and R is
determined by math, not by anything about how the movement is generated? It’s
certainly not because these researchers are not good at math; nor is it because
they are not extremely intelligent. I think the only possible explanation –
and the one that is very relevant to PCT – is that these researchers were (and
still are) blinded by the wrong view of what behavior is: a view that sees behavior as a step –
usually the last one – in a sequential causal process. They can’t help seeing a
pattern of movement – in terms of the degree of curvature of that movement measured as the
R (or C) – as caused by a pattern of forces that move a point though those
curves at varying velocity (measured by V). I think this same view of behavior
is the reason why my discovery of the mathematical relationship between V and R
led to such dismay on CSGNet.
RM: The power law is important because it shows that you
have to be able to look at behavior though control theory glasses – see that
behavior is control – before you can correctly apply the theory of control –
PCT – to behavior. The truth is that because I understood this fact about behavior I knew that the power law could tell us nothing about how organisms produce movement
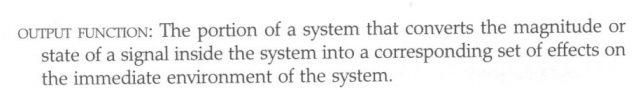
patterns before I discovered the mathematical relationship between R and V. When output is
produced in a control loop you can’t “see” the output function that is
producing the controlled result. This is one of the reasons why the
conventional approach to research is guaranteed to produce results that are
misleading (as per Powers 1978 Psych Review article). But it’s often very
difficult to show this clearly to researchers. That’s why my discovery of the
fact that there is a mathematical relationship between R and V was so exciting;
it shows as clearly as I can imagine that looking at behavior – like drawing a
squiggle pattern – as a step in a causal sequence is the wrong way to look
at the behavior of a control system. And
in this case, research based on this view of behavior is misleading in
the worst possible way; it’s leading researchers to take a mathematical fact about curved movement as
a fact of behavior to be explained.
RM: The power law research shows why PCT has had a hard time
getting accepted (by mainstream psychologists) or understood (by many of its
fans). PCT is a model of a different
phenomenon than the one studied by mainstream psychologists. Mainstream
psychologists, like the ones doing the power law research, are studying (and
trying to explain) the phenomenon of output generation; control theorists (of
the PCT persuasion) are studying (and trying to explain with PCT models) the
phenomenon of input control. I think the power law can show why it’s hard for
mainstream psychologists to get excited about a theory (PCT) that is not an
explanation of the behavior they want to explain; indeed, PCT is not only an
explanation of a phenomenon that is not the one that conventional psychologists
want to explain; PCT also shows that the phenomenon that conventional
psychologists want to explain is an illusion.
RM: I’m attaching the spreadsheet that I used to do the
calculations to test for a 1/3 power law relationship between V and R (and A and C) for various movement patterns. It’s not very user friendly (though you can use the buttons to load in some of the movement patterns) and I don’t have time to explain it
now but those of you who are interested and can read spreadsheet equations can
check it out and at least see how I did the calculations of the variables (and see if all seems correct). It’s
got macros in it so you’ll get a warning. But there are no viruses in it.
Best regards
Rick
–
Richard S. Marken
“The childhood of the human race is far from over. We
have a long way to go before most people will understand that what they do for
others is just as important to their well-being as what they do for
themselves.” – William T. Powers
V = D1/3 *R1/3
where D = |X.dotY.2dot-X.2dotY.dot|
RM: So the math shows that there is a power relationship between
R and V with a coefficient of .33 (1/3) which should hold for all two
dimensional movement patterns as long as the variable D is taken into account.
I tested this out for several movement patterns using multiple regression on
the logs of variables R and D. The multiple regression equation was of the
form:
log (V) = a * log (D) + b * log (R)
where both a and b are predicted to be .33. The result for all movement patterns was that the regression picked up all the variation in log (V) (R^2 always = 1.0) and the a and b coefficients were .33.
RM: The research on the power law relationship between V and R has resulted in the finding of coefficients for a power law relationship between R and V other than .33 for patterns of movement that differ from an ellipse and for patterns produced by movements in contexts other than in air and by species other than humans. I thought this might be because these studies had included only log (R) as a predictor of log (V) in the regression analyses. And my initial spreadsheet analyses suggested that this was the case. But after rechecking and correcting some of my spreadsheet calculations I have found that regressing just log (R) on log (V) will result in an R^2 of 1.0 and a power coefficient of .33 for any pattern of movement as long as there is no point in the pattern where the first derivatives of X and Y are exactly equal. Why that should be, I don’t know. Perhaps someone who is more math savvy than I can figure it out.
RM: But here is an example of a movement pattern that results in a perfect power law relationship between V and R with a power coefficient of exactly 1/3.