[Martin Taylor 2009.11.11.13.46]
To Bill Powers [From Bill Powers (2009.11.11.0845 MDT)]
BP: I would have to ask what happened to Rick’s repeated warnings about
the
behavioral illusion. As far as I know, the only way to see whether a
subject is controlling for the average ratio of SS# to bid is to
disturb
the ratio and see if the ratio is restored to its former value by a
change in the subject’s behavior.
MT: (I note that my spell checker complains about the missing “u” in
behaviour  Rick considers that the SS# should be taken as a
disturbance to that ratio, in which case, perfect control would bring
the ratio to the same value for each bid made by a given subject. I
agree with him. We can use these data in “The Test” to see whether that
is indeed the case, provided that the subjects with different SS
numbers can reasonably be assumed to control with a similar range of
reference ratios. The fact that these data are based on subject groups
rather than individuals does make the analysis problematic, but we work
with what we have.
My suggestion also implies the use of “The Test”, taking SS# as a
disturbance to a controlled variable. It proposes that the controlled
variable is not that ratio, but the perceived value reported for the
bid, and that the SS# disturbs the perception of the value
corresponding a number in some way. Below, I will report the results of
testing the assumption that this “some way” is a pure scaling, meaning
that the SS# multiplies the apparent value of all bid numbers by a
constant for a particular subject. As does Rick’s, this suggestion
treats the variation of the SS# as a disturbance to the proposed
controlled variable, and the analysis asks how well the subjects are
controlling if indeed the proposed controlled perception is the correct
one.
No, it’s not a tracking study, I’m afraid.
[From Rick Marken (2009.11.11.0920)]
Martin Taylor
(2009.11.10.23.48)_-
Rick Marken (2009.11.10.1320)
The reference ratio of bid/SS# is .2. My SS# (last 2 digits)
is .55. If I bid 11 the perceived ratio of bid/SS# will be at the
reference.
Two questions.
- Where does this reference ratio come from.
Higher order control systems.
What might a higher control system be controlling for that requires a
particular value of a bid/SS# ratio in order to bring its controlled
perception near its reference value?
- What is it about the different objects that disturbs this putative
higher level controlled perception to change that reference value?
I think what is controlled at the higher level must be something like
the relationship between the object and the price.
Somehow I don’t see in that answer what it is that makes the
relationship for keyboards so different from the relationship for
chocolate. What difference between keyboards and chocolate disturbs
whatever perception that is controlled at this higher level? In other
words, what is that perception whose output function alters the
reference for the bib/SS# ratio, and why is it so differently disturbed
by chocolate as compared to a keyboard?
On
the assumption that the reference value averaged across subjects for a
specific object was fitted by value = k*SS# + constant, I get the
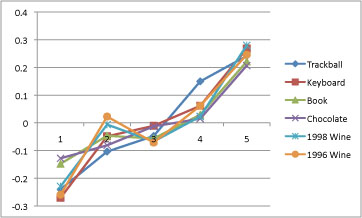
following values for k:
Trackball 0.2222
Keyboard 0.43415
Book 0.18725
Chocolate 0.12405
1998 Wine 0.1977
1996 Wine 0.2687
Nice. Makes some sense.
Those reference values for k range over a factor of about 3.5, so there
must be something about the specific objects that disturbs some
higher-level controlled perception in such a way that its output to the
reference input of the bid/SS# ratio control system varies over this
wide range. What about the objects might be perceived to produce that
disturbance?
I think we just learn from experience what references to set for the
relationship between the objects and what they cost.
That’s not answering the question, either. We aren’t asking about the
relationship between objects and what they cost, but about the
relationship between bid price and SS#, which is not something of which
we have any prior experience. Specifically, I asked what perception is
disturbed by a property of the objects, that is brought back to its
reference value by altering the reference value for the relationship
between objects and the bid price.
…
Again, I think the fit depends strongly on the fact that the data
points represent averages over subjects who are likely to be
controlling for different variables or the same variables at different
references. All the data show is that, on the average, there seems to
be a tendency to be influenced in one’s bids by SS#, suggesting that
most subjects incorporate SS# in some way into the perception they are
controlling with their bid.
Yes.
Really, I don’t think we can say at this point
that either proposal is
well supported by the data, the “bid/SS#=k” proposal because it doesn’t
fit the data, and the “altered perception” proposal because its form
would need to be fitted by reference to the data it is supposed to
explain, meaning that a data-fit test would not be legitimate.
I think your “altered perception” proposal is very similar to my
bid/SS# proposal. In both cases, the SS# is a disturbance to a
perception that includes both the bid and SS#; It is that perception –
call it “value” perhaps – that is being controlled by the subject.
Controlled perceptions are perceptions that are functions of both
environmental events (disturbances), such as the SS#, and behavioral
outputs, such as the bid. When you think of it that way – rather than
as the SS# having an effect on the bid perception – then you have a
better idea of the controlling that’s going on in this experiment, I
think.
Yes. The difference between the proposals is that the altered
perception proposal considers that there’s no relation between the bid
and the SS#, but there is a relation between the SS# and the perception
of the magnitude of the number that is used for the bid. Both proposals
consider the SS# to be a disturbance to a putative controlled variable,
so to test between them we really ought to use the same technique as
you used in comparing different putative controlled variables when a
rectangle is being controlled to stay the same size (if I remember
correctly). The following is an attempt to do just that.
I did say yesterday that it would not be legitimate to use the data to
specify the parameters of the test, but then I realized that this is
what we always do when fitting curves, and it’s OK provided the fits
don’t use too many of the data degrees of freedom. So I went ahead and
made an Excel model for the “altered perception” proposal, namely that
the imagination of the SS# simply multiplies the scale of the numbers
when they are used to represent value. In other words, after imagining
SS# X, the subject scales all the subsequent numbers by x, so that an
object for which an appropriate value is, say, $10 would be given a bid
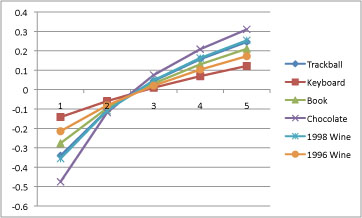
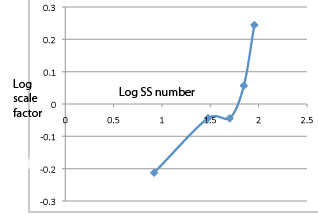
of $10*x. The data suggests this as a reasonable possibility, because
when they are plotted logarithmically the plots for the six different
objects form pretty good parallel curves (as I showed in my previous
two messages).
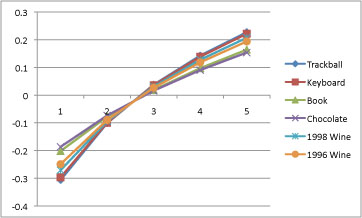
So, for each of the five SS# bands individually, I generated a scaling
factor by averaging the differences of the log bids for each object
from the overall average log bid for that object across SS# bands, and
then exponentiating this average difference. I then divided each of the
bids by the resulting ratio to create a synthetic (predicted) bid. If
scaling is the correct influence of the SS# on the perception of the
value corresponding to that number, and perceived value is the
controlled variable, then the scaled bids for any one object should all
be identical across SS# bands. Every scaled bid should be the same as
the average scaled bid for that object. This approach uses 5 df from
the data to estimate the other 25.
To test this Altered Perception (AP) quasi-model against the
“Bid-Ratio” (BR) quasi-model, I estimated what the bids would have been
if control against the SS# disturbance were perfect under either model.
To recapitulate what I did for the BR model, I fitted a straight line
through the data points for each object and estimated a slope and
average for each. Perfect control under this proposal would yield
points exactly on this line, so those points became the predicted
(synthetic) bids. This approach uses 10 df to estimate the other 20.
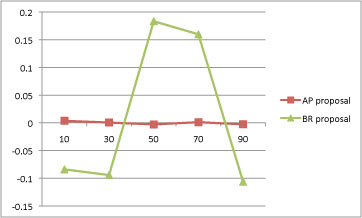
To test the degree of control implied by each proposal, I took the
ratio between the predicted and actual bids for all 30 data points, and
subtracted 1.0 (since with perfect control the ratio would be exactly
1.0). The standard deviations of these residual error ratios were .152
for BR and 0.097 for AP. Interestingly, although neither explicitly
uses the average values over objects at any stage in the analysis,
there is a big difference in how well the two proposals fit those
averages. This figure shows the deviation of the average residual error
ratios across objects for the different SS# bands under the two
proposals.
When I made my initial interjection into this thread, I wanted only to
suggest a possibility different from those that had been proposed, all
of which involved altering the reference value for some controlled
perception, as a consequence of a disturbance to another. I wanted to
suggest that there might be no alteration in the reference value for
any controlled perception when the SS# disturbance was introduced, but
that instead maybe the perception that was being controlled was altered
by the disturbance. I had not expected that such a simple effect as a
pure scaling of the perceived magnitude of the number used to match the
perceived value of an object might suffice to explain so much of the
data. Even yesterday I did not expect that, but the parallelism of the
log bid values for the different objects led me to try it. The results,
especially the result shown in this figure, surprised me greatly.
None of this proves that the controlled variable is indeed the
perceived magnitude of the number to be equated with the object’s
value, but it does say that if subjects are controlling either of the
two proposed perceptual variables in the way proposed, and if the
behaviour of group averages can in this case be taken as representative
of any single subject, then the “Altered Perception” proposal should be
preferred to the “Bid Ratio” proposal on three grounds:
-
AP uses fewer degrees of freedom in its explanation by a factor of
2,
-
AP fits better by a ratio of about 3/2 (meaning that the fit per
degree of freedom used is about 3 times better), and
-
the AP average residual error fits are very much smaller are not
affected by the SS# range.
I’m afraid this has been too much fun and taking more of my time than
I had intended to spend away from what I ought to be doing. So I will
probably retire again for a while except for possible short intrusions.
Martin