The whole point of a regression analysis is to find out the unknown relationship between the variables. If we already KNOW that D = V^3 * R^-1, then we don’t need any kind of statistics to show us that relationship. The regression analysis will always just return the coefficients that were there in the formula, regardless of the values of V and R, and regardless of the relationship between V and R.
Not mathematically. They are dependent on each other by the formula:
V = C^-1/3*D^1/3
And behaviorally, V and C are dependent, not independent, variables since they are produced by the motor outputs of the nervous system. The relationship between these two output variables is not necessarily a controlled variable. It is most likely a side effect of producing outputs that control other variables, as it is in your model.
I see that Exp 1 can be considered a test to determine whether the power relationship between V and C is a controlled variable. The disturbance is the different speed patterns, and thus different power law values, for the movement of the target dot. If the power law were a controlled variable, these disturbances would have little effect. Yet, when moving slowly, the disturbances are apparently completely effective; the power law is not seen. However, it is seen when the movement is fast. Does this mean that the power law is only controlled when the movement is fast?
The answer is provided by your model, which doesn’t control for a power law relationship between V and C, but fits the subject’s behavior in both the slow and fast movement conditions nearly perfectly. The model controls the varying position of the cursor (c.x, c.y) relative to a reference (called the “virtual target” in the paper) provided by higher level systems controlling phase and size difference. Nevertheless it accounts for the power law seen in the fast movement condition and the lack of power law seen in the slow condition!
Great. You came to the same conclusion.
OK, you can be the only one to have done TCVs if you like. What’s important is that you came to the right conclusion: the power law is a side effect of controlling other variables while making curved movements. The omitted variable bias (OVB) analysis that I described in the Marken & Shaffer (2017) paper is an explanation of why this side effect is seen.
Speed is definitely slower in steep curves compared to shallow curves. That’s what you will always see, to varying degrees, according to the mathematical relationship between V and C. What is “apparent” (illusory) is seeing this as “slowing down”, which implies that there is some kind of behavioral or physical process which is causing the slow down.
It depends on what you mean by “slowing down”. If all you mean is that V decreases when C increases, then I already agree with the claim; I’ve made a whole lot of power law plots of V against C and there is no question that there is always a negative relationship between V and C, the slope and strength of which varies over different movements but is always negative.
But if you mean by “slowing down” that the decrease in V is an active reaction to an increase in C, then I would have to see empirical evidence that this is the case. And if I saw it and it was convincing then, of course, I would agree that a person doing the cursor tracking task actively slows down in response to increasing curvature.
But we never do a regression to find D. I thought the analogy was great the way I initially understood it but now I don’t understand the relevance of this analogy to the power law research.
I calculate V, C and D from the raw data, not from each other.
I don’t see this as analogous to how regression is used in power law research. So I agree with you last comment:
As I said above, the empirical data definitely show that movement is slower in steep compared to shallow curves. There is a negative correlation between V and C. But correlation does not imply causation. So if by “slowing down” you mean that increases in C cause decreases in V, then I would need non-correlational evidence that this is the case.
I think your research has shown rather clearly that the power law is a side-effect of control of other variables, such as the position of the stylus that is being moved. This shows that the appearance of this side effect has nothing to do with how the movement was produced. That seems like a rather important thing for the community of power law researchers to know.
This is why I’m making the analogy with rectangles.
Introducing D here is like saying that the width of a rectangle depends on the area of a rectangle. It doesn’t. Width and height can vary independently.
V and C can be found from raw data independently. There is no way to calculate D from the raw data independently from V and C. If you can show that there is, I would agree I’m wrong.
What evidence would you accept that V and C are independent? What about moving with different speeds along the same curve?
I’ve made a very similar mistake with angular speed. And also some of the power law researchers when they claimed that the angular speed vs curvature power law is equivalent to the tangential speed vs curvature power law. They are not equivalent, angular speed depends on curvature. I wrote a paper about my mistake.
True, the power law does not appear at all at low speeds. The speed and position errors are very low, and the plots show that the participants follow the speed of the target, that is why I say that the participants could be controlling instantaneous speed at low average speed. The problem at low speeds is apparently the noise in recording that does not get removed by smoothing, and gets amplified by the method used to estimate both speed and curvature. That is why I have the box labeled ‘measurement noise’ in the model.
Everyone (on csgnet) agreed with the hypothesis that the power law relationship is not the controlled variable. The problem was to show it experimentally. I’ve shown that it is not controlled, and that it can come from controlling other variables if there is a low pass filter included in the loop, and the movement is fast. The low pass filter is crucial here. The controlled variables may change. There is no use of angular phase difference in shapes other than ellipses, for example. The number 8 does not have an unambiguous phase difference like an ellipse does, but we can still draw it in a rhythm. So, maybe the arc-length difference is the controlled variable.
Now, when it comes to OVB, you can’t have it both ways. The power law is either a statistical artefact or a real phenomenon. Either the speed is lower is curves or it only appears so.
We have already established, empirically, that the speed is lower in curves, and you agree that it is. So, the power law is a real phenomenon, not a statistical artifact. I’m making no claims about causality, pure correlations. That is all the power law is - a correlation between speed and curvature.
But it has everything to do with how the movement was produced. The loop must include a low-pass filter and the movement has to be fast. The controlled variables could change, but low-pass filtering and speed have to stay.
I didn’t “introduce” D. That’s part of the equation you get when you solve for the mathematical relationship between V and C. It’s exactly the same equation as the one presented by Maob et al as shown here:
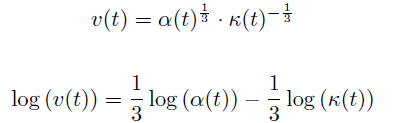
In the top equation alpha(t) is equivalent to D in our equation and kappa(t) is equivalent to our C. This equation defines the exact, mathematical relationship between speed (v(t) for them, V for me), curvature (kappa(t) for them, C for me) and affine velocity (alpha (t) for them, D for me). Affine velocity is computed as follows:
![]() (a)
(a)
This is the way I computed it as well.
The log version defines a linear regression equation that can be used to predict V from C and D. This equation describes the exact mathematical relationship between V, C and D, so the prediction should be perfect with estimates of the coefficients for C and D equal to exactly -1/3 and 1/3, respectively, and the R^2 for the regression equal to 1.0. And, indeed, this is what I have found to be true for all curved movement, including perfectly circular movements (for which the coefficient for C is 0 when D is omitted from the regression) and orbital movement (for which the coefficient for C is -.67 when D is omitted from the regression).
That the relationship between C and V is the same regardless of variations in D where D is computed as defined in equation (a) above.
OK, so now, thanks to you, we know that the power law is not the variable controlled when making curved movements; it is simply a compelling but irrelevant side effect of controlling some other variable. So now it’s time to forget about the power law and start studying movement as a control phenomenon.
The fact that the power law is a statistical artifact doesn’t mean that it’s not a real phenomenon. The speed of a curved movement really is slower through tight curves and faster through gentle curves. There is a negative power relationship between C and V such that the speed of the movement decreases exponentially with increasing curvature.
All OVB analysis shows is that the exponent of this power relationship will vary around -1/3 (the “lawful” value) to the extent that the omitted variable from the regression, D, covaries with the predictor included in the regression, C.
The artifact revealed by OVB is simply that the observed exponent of the the power relationship between C and V will depend on mathematical characteristics of the movement produced – characteristics that affect the covariance between C and D – and not on factors involved in production of the movement.
It’s both, just like the bent appearance of a stick placed in water. The bending is an artifact of differential refraction of light by air and water but the apparent bend is a real phenomenon; you see a bent stick.
So why the continued interest in it?
Low pass filtering is intrinsic to a stable control loop so low pass filtering will “stay” in any control model that matches the behavior of a living system. It’s not uniquely essential to seeing a -1/3 power law as can be seen from the fact that it matches the behavior that doesn’t produce the -1/3 power law as a side effect.
And speed only mattered in the ellipse tracking situation that you used. I’ve been able to make squiggly movement patterns (without tracking) at a relatively slow average speed (not much faster than your .27Hz “slow” speed, I think) and get power exponents close to .33 (I just tried it and got a .35).
You have a nice model that accounts for the behavior in your studies nearly perfectly. And you know that the power law is a side effect of the controlling done by this model. So why the continued interest in finding out what accounts for the power law?
Yeah, that is the magnitude of the cross-product of the velocity and the acceleration vectors. The raw data used to compute affine velocity are the velocity vector and the acceleration vector. The magnitude of the velocity vector is speed, and the accelerating “sideways” creates curvature. You see where I’m going with this? The area of a rectangle is calculated as a product of the width and the height. You are creating a third variable, completely dependent on the first two, and calling it an independent predictor.
Yes, absolutely, those coefficients will always be -1/3 and 1/3, not just for curved movement, but for straight movement, for random movement, for any random variables. Multiple regression here is simply returning the coefficients from the formula.
Why would you ever do multiple regression to retrieve the coefficients from a known relationship?
That would prove that D is independent of the C-V relationship, and I’m asking just for the V and C relationship, without involving D.
Like I said, you can go along the same path using different speeds - these variables are completely independent.
Yes, it does. Oxford dictionary: "A statistical artefact is an inference that results from bias in the collection or manipulation of data. The implication is that the findings do not reflect the real world but are, rather, an unintended consequence of measurement error.
Since we agree that in certain situations speed and curvature covary, then we must conclude that it is not a statistical artifact. The stick is really bent in this situation, it is not just that it appears bent.
Here is an illustration of the magnitude of the cross-product:
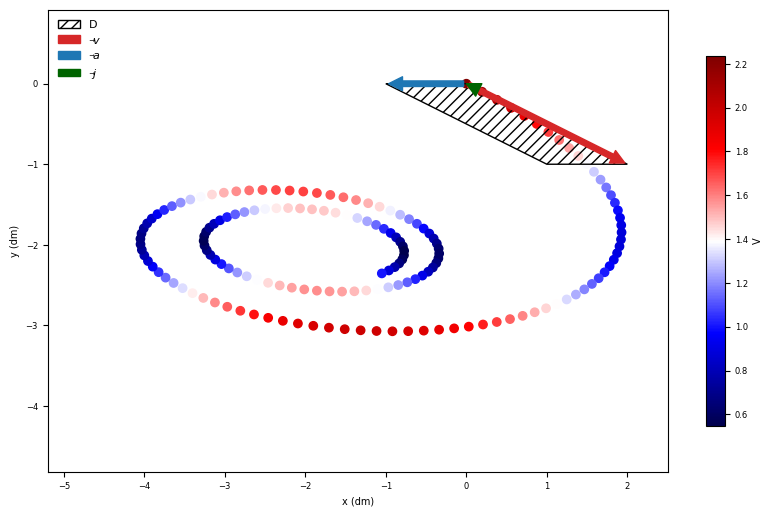
The color-code shows speed, the velocity vector is v; or [x’, y’] , acceleration vector is a, or [x’‘, y’'] and the variable D is the area of the parallelogram closed by vectors a and v, equal to the mentioned magnitude of the cross product a x v.
Adam, great illustration, thank you!
I will utilize this occasion to consider some concepts that have appeared in this discussion.
First the BS-word (as Warren expressed it): bullshitting as a verb and bullshit as a products of that doing. Surprisingly BS is a more or less established and discussed philosophical concept after Harry Frankfurt’s influential essay On Bullshit (2005). A recent article even mentions bullshitology as an important area in the argumentation theory and the philosophy of science. So it is really a relevant academic question whether for example some Rick’s argument is a form of argumentative bullshit and what kind of.
The second is side effect. For me it has been one of the most important and enlightening concepts in PCT especially because of Martin Taylor’s analyses. Now when I looked back, Powers uses it very little. For example in B:CP it is mentioned only three times and always in a similar somewhat strange meaning like all the effects of control in the environment were just side effects: “There is the strong suggestion that the reference signals come down saying, “make it feel like this,” and a few tens of milliseconds later the perceptual signals proceed back upward, “feeling like this.” As a side effect, forces are exerted on the external world. (p. 87)”
More reasonable seems Martin’s differentiation of the main effect and the side effects in the environment. The main effect is the caused change in the environment which causes the “feeling like this” perceptual signal to be produced in the perceptual input functions. Side-effects are other changes caused by the output in the environment which do not take part to the production of that perceptual signal. These side effects can affect the control of other perceptions by the same or other controllers – and they can even affect the subject’s subsequent control of the same perception.
I have further differentiated between primary and secondary side effects. Primary are those caused straight by the output and secondary are those caused by the main effect in addition to its effect to input functions. For example many fatal conflicts in the world and the threatening climate catastrophe are somehow results of side effects of control. Thus side effects are extremely important object for research!
Third concept is that of affine velocity. We know that it is a mathematical transformation of the velocity of a moving object which takes in to account also the form (curvature) and dynamics (accelerations) of the moved trajectory. (Adding it to the statistical calculation of correlation between it, velocity and curvature is a first lesson error like calculating correlation between bachelorhood, malehood, and non-marriage – what else than bullshit?) Power law means the same as affine velocity being stable. Now in a quite recent article: A haptic laparoscopic trainer based on affine velocity analysis: engineering and preliminary results (2021) they have found out that the skillfulness of the trainee in laparoscopic operations can be estimated from the affine velocity of the movements she creates. I can’t evaluate the reliability of this research and not even explicate its details but the idea is interesting. Somehow the affine velocity must tell about the smoothness and security of the movements. If this is so then the stable affine velocity (= accordance to the power law) could be a necessary tool or method for controlling well done laparoscopic operations. So its questionable whether power law at least in some occasions is a side effect at all but rather a part of the main effect. At least it is definitely not an irrelevant side effect.
What you think?
I don’t like calling it ‘bullshit’ anymore. It gives people an out for rudeness, and I’d prefer to keep discussing, maybe find areas of agreement. With Rick, so far, we can’t even agree whether the phenomenon of slowing down in curves is real or a statistical artifact (since that would imply he published a mistake, I guess), so not much agreement to build on.
For me, the main effect of a feedback loop is keeping the perceptual and the reference signal stable, despite disturbances, and then everything else is a side effect. So, yeah, including all the changes made by the output that don’t feed back to perception. I think that talking about causes and effects can be accurate, but it can’t really be very precise when describing control loops.
Interesting plot from that paper:
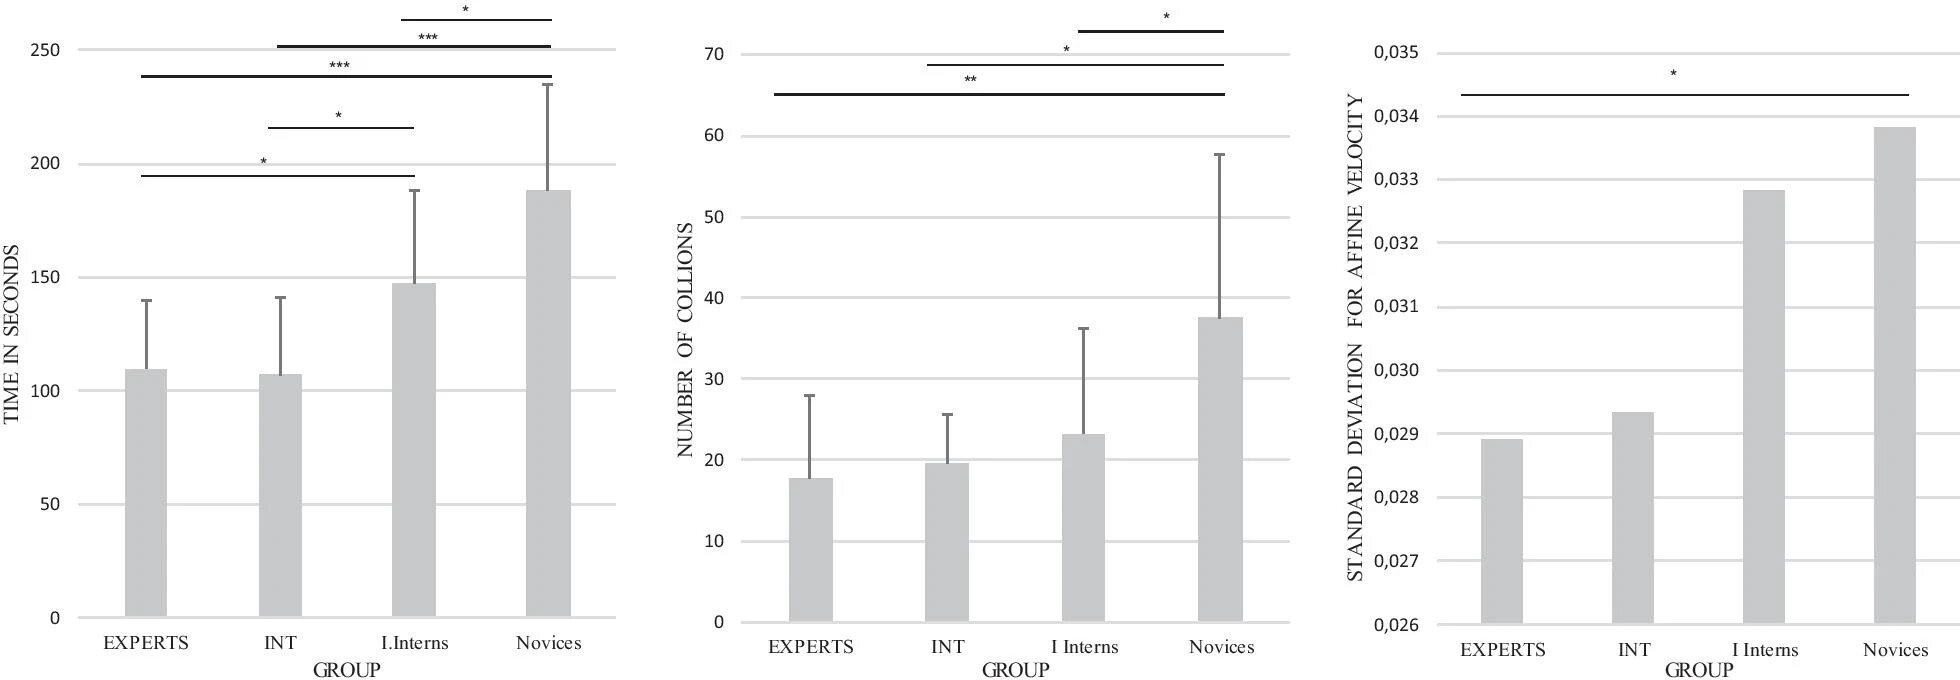
The experts did that task in a much shorter time, made less collisions and had a more stable affine velocity.
Sure, the first hypothesis when seeing this plot could be that the stable variable, affine velocity, is controlled. With practice, the surgeons learned to control it better, maybe?
Affine velocity is the cube root of the variable D from the other plot (Va = D^1/3). A stable D would mean that if the curvature is increasing, the speed is decreasing, and when the curvature is low, the speed is high. The VC power law exponent for constant Va or D is -1/3. In my experiment, this power law only appeared at high speeds, so my guess is that the constant affine speed appears in expert surgeons simply because they can move faster, they know where in the path they can move fast, and where not. In the first plot, they do the task in much less time. The interns make a relatively low number of the collisions - so they can move accurately, but they are not fast, and their Va is not that stable, has a high SD. The Va still seems like an OK proxy for expertise, from what I can see, you do need to be both fast and accurate.
After a more careful reading of the paper by Maoz, Portugaly, Flash and Weiss (2005) I saw that they almost came to the same conclusion as we did in Marken & Shaffer (2017) – that the power law is a statistical artifact in the sense described in your definition – but they backed down. Maob et al based their conclusion on exactly the same mathematical analysis that we did. They did what we called an OVB (omitted variable bias) analysis of the power law 11 years before I independently came up with the idea.
The equivalence of our analysis to that of Maob et al is rather clear. Our equation for the predicted value of the observed power law coefficient
![]()
is exactly equivalent to theirs
![]()
where our beta.true corresponds to their -1/3 and our delta corresponds to their eta/3 since
![]()
and our delta is given by
![]()
where beta.omit – the beta for the omitted affine velocity variable – equals 1/3.
So here we have two identical analyses of the power law of movement, yet one is seen as a great contribution to power law research and the other makes power law researchers’ (Zago, Matic et al, 2017) and would be PCT gurus’ (Taylor, 2017) heads explode.
Both Zago, Matic et al and Taylor went to considerable mathematical lengths to show that our analysis was wrong – embarrassingly wrong. This, despite the fact that one of the authors of the Zago Matic et al paper, Tamar Flash, was a co-author of the Maob et al report and should have seen the mathematical equivalence of our analysis to that of Maob et al immediately. But my guess is that it was not the math that led to the different reactions to the identical analyses; it was the conclusions.
Marken & Shaffer concluded from their analysis that the power law is a statistical artifact. Moab et al almost came to the same conclusion but pulled back from the brink by saying: "We do not suggest that the power law, which stems from analysis of human data, is a bogus phenomenon, resulting only from measurement noise". Given your definition of “statistical artifact” what Maob et al were pulling back from was saying what was pretty clear from their simulations: the power law is a statistical artifact.
But instead of coming to the obvious conclusion, at a conference packed with power law researchers, they came, instead, to the conclusion that power law researchers “should always be sure that the signal-to-noise ratio in the system [under study] is well within the bounds where it does not drive the results toward the power law”. This conclusion is based on simulations run by Maob et al that showed that the addition of even small amounts of noise to non-power-law conforming movements results in the observation of a power law (due, presumably, to the reduction of the covariance of curvature with affine velocity).
So the difference between Marken & Shaffer and Maob et al is in their conclusions about the power law being a statistical artifact: Marken & Shaffer say it is; Maob et say it isn’t. Since we came to what was apparently the “wrong” conclusion it was assumed that out analysis – the math – must be wrong, even though it is the exact same analysis – and math – as the one done by Maob et al who came to the “right” conclusion. So it looks like, unless I come to the consensus conclusion that the power law is not a statistical artifact, there is no way for me to mathematically demonstrate that that is the case.
But whether or not the power law can be accounted for as a statistical artifact, it is still clear that it is an irrelevant side effect that has nothing to do with the nature of the behavioral processes that produce it. It is “irrelevant” in the sense that it tells you nothing about those processes. This is clear from Fig. 1 in Marken & Shaffer (2018), which shows that a power law conforming movement (Fig 1A) can be produced by power law non-conforming movements of the mouse (Fig 1B) :
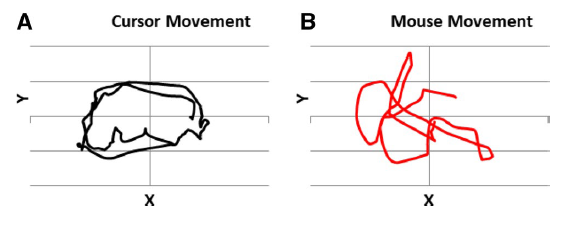
This is also shown in Fig 9 of the “Behavioral Illusions” paper by Marken, Kennaway & Gulrez (2021)

Here we see a power law conforming movement of a cursor produced by power law non-conforming movement of a mouse, and this is being done by a person (participant) and a two level control model of that person. The model behaves almost exactly like the person; overall correlation between model and person behavior is .98
These simple demos show that the power law is an irrelevant side effect of control but they don’t explain why a power law is often seen as a side effect of this controlling. That’s what the OVB analysis in Marken & Shaffer (2017) was meant to show. I’m afraid we spent too much time on that analysis because the conclusions of that analysis were what got everyone up in arms against us.
I don’t care too much about whether people find OVB (and the Maob et al) analysis a convincing explanation of why something close to a power law relationship between speed and curvature of movement is often found. But I do think the results presented above, in Fig 1 of Marken & Shaffer (2018) and Figure 9 of Marken et al (2022) are pretty convincing evidence that the power law is an irrelevant side effect of control of the position of the entity being moved (cursor, finger, stylus) relative to a variable internal reference.
RSM
Thank you for these clarifications.
Your approach to discussion is really a good PCT way: to find something common (and rather in a higher level).
About causes and effects: perhaps even generally when we say that “x causes y” we should rather say that “x takes essentially part in causing y (because z and other factures have caused x)”
Eetu
| amatic
August 9 |
- | - |
EetuP:
So it is really a relevant academic question whether for example some Rick’s argument is a form of argumentative bullshit and what kind of.
I don’t like calling it ‘bullshit’ anymore. It gives people an out for rudeness, and I’d prefer to keep discussing, maybe find areas of agreement. With Rick, so far, we can’t even agree whether the phenomenon of slowing down in curves is real or a statistical artifact (since that would imply he published a mistake, I guess), so not much agreement to build on.
The second is side effect.
For me, the main effect of a feedback loop is keeping the perceptual and the reference signal stable, despite disturbances, and then everything else is a side effect. So, yeah, including all the changes made by the output that don’t feed back to perception. I think that talking about causes and effects can be accurate, but it can’t really be very precise when describing control loops.
Third concept is that of affine velocity.
Interesting plot from that paper:
The experts did that task in a much shorter time, made less collisions and had a more stable affine velocity.
Sure, the first hypothesis when seeing this plot could be that the stable variable, affine velocity, is controlled. With practice, the surgeons learned to control it better, maybe?
Affine velocity is the cube root of the variable D from the other plot (Va = D^1/3). A stable D would mean that if the curvature is increasing, the speed is decreasing, and when the curvature is low, the speed is high. The VC power law exponent for constant Va or D is -1/3. In my experiment, this power law only appeared at high speeds, so my guess is that the constant affine speed appears in expert surgeons simply because they can move faster, they know where in the path they can move fast, and where not. In the first plot, they do the task in much less time. The interns make a relatively low number of the collisions - so they can move accurately, but they are not fast, and their Va is not that stable, has a high SD. The Va still seems like an OK proxy for expertise, from what I can see.
Yeah, if you take a very noisy trajectory, you can get a fairly high r2, but not above 0.7, so you know, taking care of noise in the experiment, by light smoothing, and having high r2 (like 0.8 or 0.9) should be done to make sure you have real slowing down in curves or not just a statistical artefact. That is what Maoz et al explore. You do have a habit of not reading papers and comenting on them, so maybe try reading again.
You’ve made a strange narrative ignoring the conflict between your two statements - that there is a real, measured slowing down in curves, and also that this phenomenon is a statistical artefact.
Also, you did not comment on the parallelogram area and the cross-product formula. You are claiming that the variable D - the area of the parallelogram - is an independent predictor of speed, which is one side of the parallelogram. If you could focus on that for a while, maybe you could see why people call your use and interpretation of OVB silly.
I’m pretty happy I found a solution to elliptic movement that involves a few versions of TCV, a model with higher-level controlled variables and an oscillator, and really nice fit to human behavior. If you read my papers carefully, study the procedures, eat your veggies, in a few years you could learn to do PCT. Good luck!
That makes me sound much nicer than I am.
Lately, it was interesting to look at the means Rick uses to maintain the narrative of “I was right all along” (my working guess for what he is controlling, or maybe “I was not wrong”). It seems that logic gets pretty loose:
a thing can be both false and true simultaneously - real and illusory. Or maybe words change their meaning suddenly, in the space of a few posts. Real strange.
So throwing out data (by filtering) ensures that you you have a real phenomenon rather than a statistical artifact? Interesting.
There is also a real increase in murders in New York City when ice cream sales increase. But many people consider this a statistical artifact, a result of failing to take into account seasonal variations in temperature.
I did comment on it because I think it’s an incorrect analogy to the situation described by my OVB and the Maob et al analysis. I never said variable D is an independent predictor of speed. It is a covariate and as Maob et al found, it can correlate with the other predictor, curvature, just as temperature covaries with ice crease sales.
I am glad you are happy even though I find you a dismayingly rude person.
“ There is also a real increase in murders in New York City when ice cream sales increase. But many people consider this a statistical artifact, a result of failing to take into account seasonal variations in temperature.”
Really? Aren’t they both side effects of people controlling for body temperature, and they are important to be aware of for various purposes - police numbers and marketing? If you couldn’t measure temperature for some reason then you could still use one to estimate the other, but very roughly. I don’t think they are a statistical artefact - they are measurements of properties of only distally related, complex control systems that have one CV on common, among many others.
Possibly, but that has nothing to do with the relationship between ice cream sales and murder rate being a statistical artifact.
Yes, murder rate is important for the police to know about and ice cream sales are important for ice cream marketers to know about. But that has nothing to do with the relationship between ice cream sales and murder rate being a statistical artifact.
True, but, again, that has nothing to do with the question of whether or not the relationship between ice cream sales and murder rate is a statistical artifact.
The measurements of murder rate and ice cream sales are not the statistical artifact. It’s the relationship between them that is the artifact. Temperature is a confounding variable in that relationship; when you “factor it out” or “statistically hold it constant” by including it as a predictor in a regression of ice cream sales on murder rate you will find that there is actually no relationship at all between ice cream sales and murder rate. So while the observed relationship between those variables is lots of fun to look at, it is completely spurious; it depends completely on a third variable, temperature.
The situation with the power law is a little different. While there is no actual relationship between ice cream sales and murder rate, there is a a mathematical -1/3 power relationship between curvature (C) and velocity (V). The confounding variable in the relationship between C and V is affine velocity (D in Marken & Shaffer, 2017).
The degree to which D is a confound differs for different movement patterns. If D is constant in he movement then it is not a confound and the observed relationship between C and V will be exactly a -1/3 power function. To the extent that D is correlated with C, however, the observed relationship between C and V will be somewhat different than -1/3. But as Maob et al found by analyzing a million randomly generated movement patterns, the correlation between C and D in a movement pattern (2D or 3D) is rarely large enough to make the observed relationship between C and V deviate very far from a -1/3 power relationship.
So the finding of the -1/3 power law – or something close to it-- is a statistical artifact in the sense that there are very few movements where the correlation between C and D is large enough so that the observed relationship between C and V is very far from its mathematically defined relationship – a -1/3 power function. In other words, you are unlikely to see anything other than something close to a -1/3 power relationship between C and V in a movement pattern because it is statistically very unlikely to find people making movements where there is a high correlation between C and the confounding variable, D.
It’s important to know that controlling has unintended side effects. But it is impossible to know in advance what all the side effects of any particular example of controlling are or will be. The -.33 power law is just one of many possible side effects of movement; an infinite number, actually. I’ve made movements that result in a power exponent of -.21, -.23, -.34 etc. Indeed, I rarely, if ever, get exactly -.33.
In real life you just have to be aware that your controlling can have unintended side effects that can affect the controlling of others. In some situations you can have a pretty good idea of what the possible side effects might be. For example, when you are controlling for asking someone to do something you know that a possible side effect of this is that a variable the person is controlling might be disturbed by your request and the person will get hurt or angry. So you try to ask as gently and kindly as possible (if you care about hurting or angering the person, of course). There’s no guarantee that your asking will not have a hurtful, angering or some other kind of side effect. But it’s nice to try to avoid such side effects if you can. It’s called being brought up right;-)
RM: Possibly, but that has nothing to do with the relationship between ice cream sales and murder rate being a statistical artifact.
What causes the rise in both ice cream sales and murder rates? Isn’t it the rise of the temperature? When there is more heat people want to cool themselves by buying ice cream or if they don’t manage to cool them they can become more aggressive, perhaps. The relationship is not made by a statistician or researcher by using some questionable statistical methods. The relationship is real. If you find yourself wanting ice cream in a heatwave then you really should be careful to stay safe.
If you want to call this kind of relationship an artefact you could call it a physical artefact.
Instead if you calculate a dependency between curvature and speed by using their common cross product as an extra predictor, that is really a statistical artefact. That method could be called doubled variable bias (DVB). That dependency has nothing to do with physical reality but is produced by the misuse of mathematics.
Eetu
| rsmarken
August 12 |
- | - |
wmansell:
“ There is also a real increase in murders in New York City when ice cream sales increase. But many people consider this a statistical artifact, a result of failing to take into account seasonal variations in temperature.”
Really? Aren’t they both side effects of people controlling for body temperature
Possibly, but that has nothing to do with the relationship between ice cream sales and murder rate being a statistical artifact.
, and they are important to be aware of for various purposes - police numbers and marketing?
Yes, murder rate is important for the police to know about and ice cream sales are important for ice cream marketers to know about. But that has nothing to do with the relationship between ice cream sales and murder rate being a statistical artifact.
If you couldn’t measure temperature for some reason then you could still use one to estimate the other, but very roughly.
True, but, again, that has nothing to do with the question of whether or not the relationship between ice cream sales and murder rate is a statistical artifact.
I don’t think they are a statistical artefact - they are measurements of properties of only distally related, complex control systems that have one CV on common, among many others.
The measurements of murder rate and ice cream sales are not the statistical artifact. It’s the relationship between them that is the artifact. Temperature is a confounding variable in that relationship; when you “factor it out” or “statistically hold it constant” by including it as a predictor in a regression of ice cream sales on murder rate you will find that there is actually no relationship at all between ice cream sales and murder rate. So the observed relationship between those variables. It’s lots of fun to look at that relationship but it is completely spurious; it depends completely on a third variable, temperature.
The situation with the power law is a little different. While there is no actual relationship between ice cream sales and murder rate, there is a a mathematical -1/3 power relationship between curvature and speed. The confounding variable in the relationship between curvature (C) and speed (V) is affine velocity (D in Marken & Shaffer, 2017).
The degree to which D is a confound differs for different movement patterns. If D is constant then it is not a confound and the observed relationship between C and V will be exactly a -1/3 power function. To the extent that D is correlated with C, however, the observed relationship between C and V will be somewhat different than -1/3. But as Maob et al found by analyzing a million randomly generated movement patterns, the correlation between C and D in a movement pattern (2D or 3D) is rarely large enough to make the observed relationship between C and V deviate very far from a -1/3 power relationship.
So the finding of the -1/3 power law – or something close to it-- is a statistical artifact in the sense that there are very few movements where the correlation between C and C is large enough to that move the observed relationship between C and V very far from its mathematically defined relationship – a -1/3 power function. In other words, you are unlikely to see anything other than something close to a -1/3 power relationship between C and V because it is statistically very unlikely to find people making movements where there is a high correlation between C and the confounding variable, D.
Yeah, anything higher than 10Hz is probably measurement noise, or similar artefact, and it is important to remove it. Nothing controversial there. If you find relatively strong power law from an unfiltered trajectory, it is either real, or it is a statistical artefact. Can’t be both. You verify the phenomenon by appropriate filtering.
Here is the definition again:
A statistical artefact is an inference that results from bias in the collection or manipulation of data. The implication is that the findings do not reflect the real world but are, rather, an unintended consequence of measurement error.
So, no, the power law is not a statistical artefact, if care is taken in preparing the data, but can be otherwise.
Interpreting various correlations as causal, where there is no causal link, is a different type of error. Some people call them spurious correlations, and the problem is not the correlation, just the interpretation. You claim, correctly, that the instantaneous curvature is not the cause of the instantaneous speed - they are happening in the same instant of time.
No one ever claimed otherwise, so the power law is not a spurious correlation.
You also claim that the relationship between three variables, D, C and V reflects the “true” relationship between two variables, C and V. That is a mistake in mathematical reasoning that Maoz et al don’t do, but you do, even though you are using the same formulas.
Now, if you were correct about that, then the power law would be a statistical artifact, but we already agreed that the correlation is real, that the speed and curvature really do correlate, so you can’t be correct.
There are many ways to show why your use and interpretation of OVB is not correct. It is like a wrong piece of a puzzle, it kinda fits loosely on one side, but then the three other sides are obviously not fitting.
I’m not giving you an analogy, I’m giving you a graphical illustration of the relationship between D and V. D is the area and V is one side of the parallelogram. Maoz et al are saying that if the area is constant, then you get the exponent -1/3 power law. You are saying that because of the existence of the formula relating D, V and C - literally the formula to calculate the area of the parallelogram - the variables used to calculate the area are also related. This is false.
The relationship may be present in the movement data or not. In my experiment, for slow movements, there is no power law. Unrelated. The relationship only appears at high speed, and if you had it appear on low speed, then maybe you used angular speed? if not, maybe the R2 was not very high (should be above 0.7 or so because of the noise) or the filtering was too strong (should not be lower than 10hz).
Oh, he talks about rudeness
![]()
Temperature is probably only one of the variables that affects that relationship. There are surely others as well, such as seasonal variations in vacation taking and school attendance.
The relationship is observed by a researcher who fails (surely unintentionally) to include all the possible predictors of yearly variations in murder rate into their prediction equation.
But the relationship between ice cream sales and murder rate tells you nothing about the relationship between temperature and murder rate. You are just guessing that temperature is the reason for the correlation between those variables. It might not be.
What relationship are you talking about? All we’ve observed is a correlation between ice cream sales and murder rate. Temperature is one likely covariate that could account for the existence of this relationship. What do you think is a physical artifact?
No, actually it’s called multivariate analysis or analysis of covariance (ANCOVA).
RSM
Given the rather dramatic effect of filter cut off on the power coefficient found by the regression it seems like the use of filtering should be a tad controversial. Besides, you can avoid the need to make assumptions about what constitutes signal versus noise in the data by fitting your model to the raw rather than the filtered data. If the best fitting model accounts for, say, 98% of the variance in the data, then I I think it’s reasonable to assume that the unaccounted for 2% of the variance is noise.
By the way, since your model fits the data in both the fast and slow movement conditions, and since the observed power coefficients in those two conditions are quite different, I believe you have shown that your model accounts for the different power exponents that are found in power law experiments – including the “lawful” value of -1/3 – as side-effects of the control process involved in producing curved movements.
I would say that filtering the data before analysis and intentionally or unintentionally leaving a variable (affine velocity) that is known, on a mathematical basis, to be a predictor (other than curvature) out of the analysis is a form of bias in the manipulation of data.
I meant it is spurious in the sense that it is not what it purports to be – a reflection of the the mechanisms that produce a curved movement.
What was the error in math reasoning that we made that Maoz et al didn’t make? Their math reasoning seemed to be exactly the same as ours.
When you do your regression analysis to find the fit to a power law you include only C as a predictor. The regression equation that you solve is:
log(V) = log(k) + beta * log (C)
The square root of the resulting R^2 of that analysis is a “real” correlation between log (V) and log (C) in the sense that it is really the correlation you get when you regress log (C) on log (V). But it is not “real” inasmuch as it is not the true correlation between log (C) and log (V). The true correlation between log (C) and log (V) is the partial correlation between these variables while controlling for the correlation between log (D) and log (C). The formula for computing it is:
Where X corresponds to log (V), Y to log (C) and Z to log (D) and rho is the correlation coefficient.
[/quote]
I’d be interested in seeing just one way our use and/or interpretation of OVB analysis is incorrect. As I showed in an earlier post, it is exactly equivalent to the analysis done by Maoz et al. I’m sorry I didn’t know about their work before I wrote the first paper on this or I would have given them credit for having come up with the idea.
I don’t recall Maoz et al mentioning parallelograms. Like us, they said that you get the -1/3 exponent of the power relationship between log (V) and log (C) if the covariance of log (C) and log (D) is 0. And one way cov(log (C),log (D)) will be 0 is if log (D) is constant. The other way is simply for log (C) and log (D) to be uncorrelated.
So it’s more of a guideline than a rule [law]. (With apologies to the Bill Murray who used the line to great comedic effect in Ghostbusters).